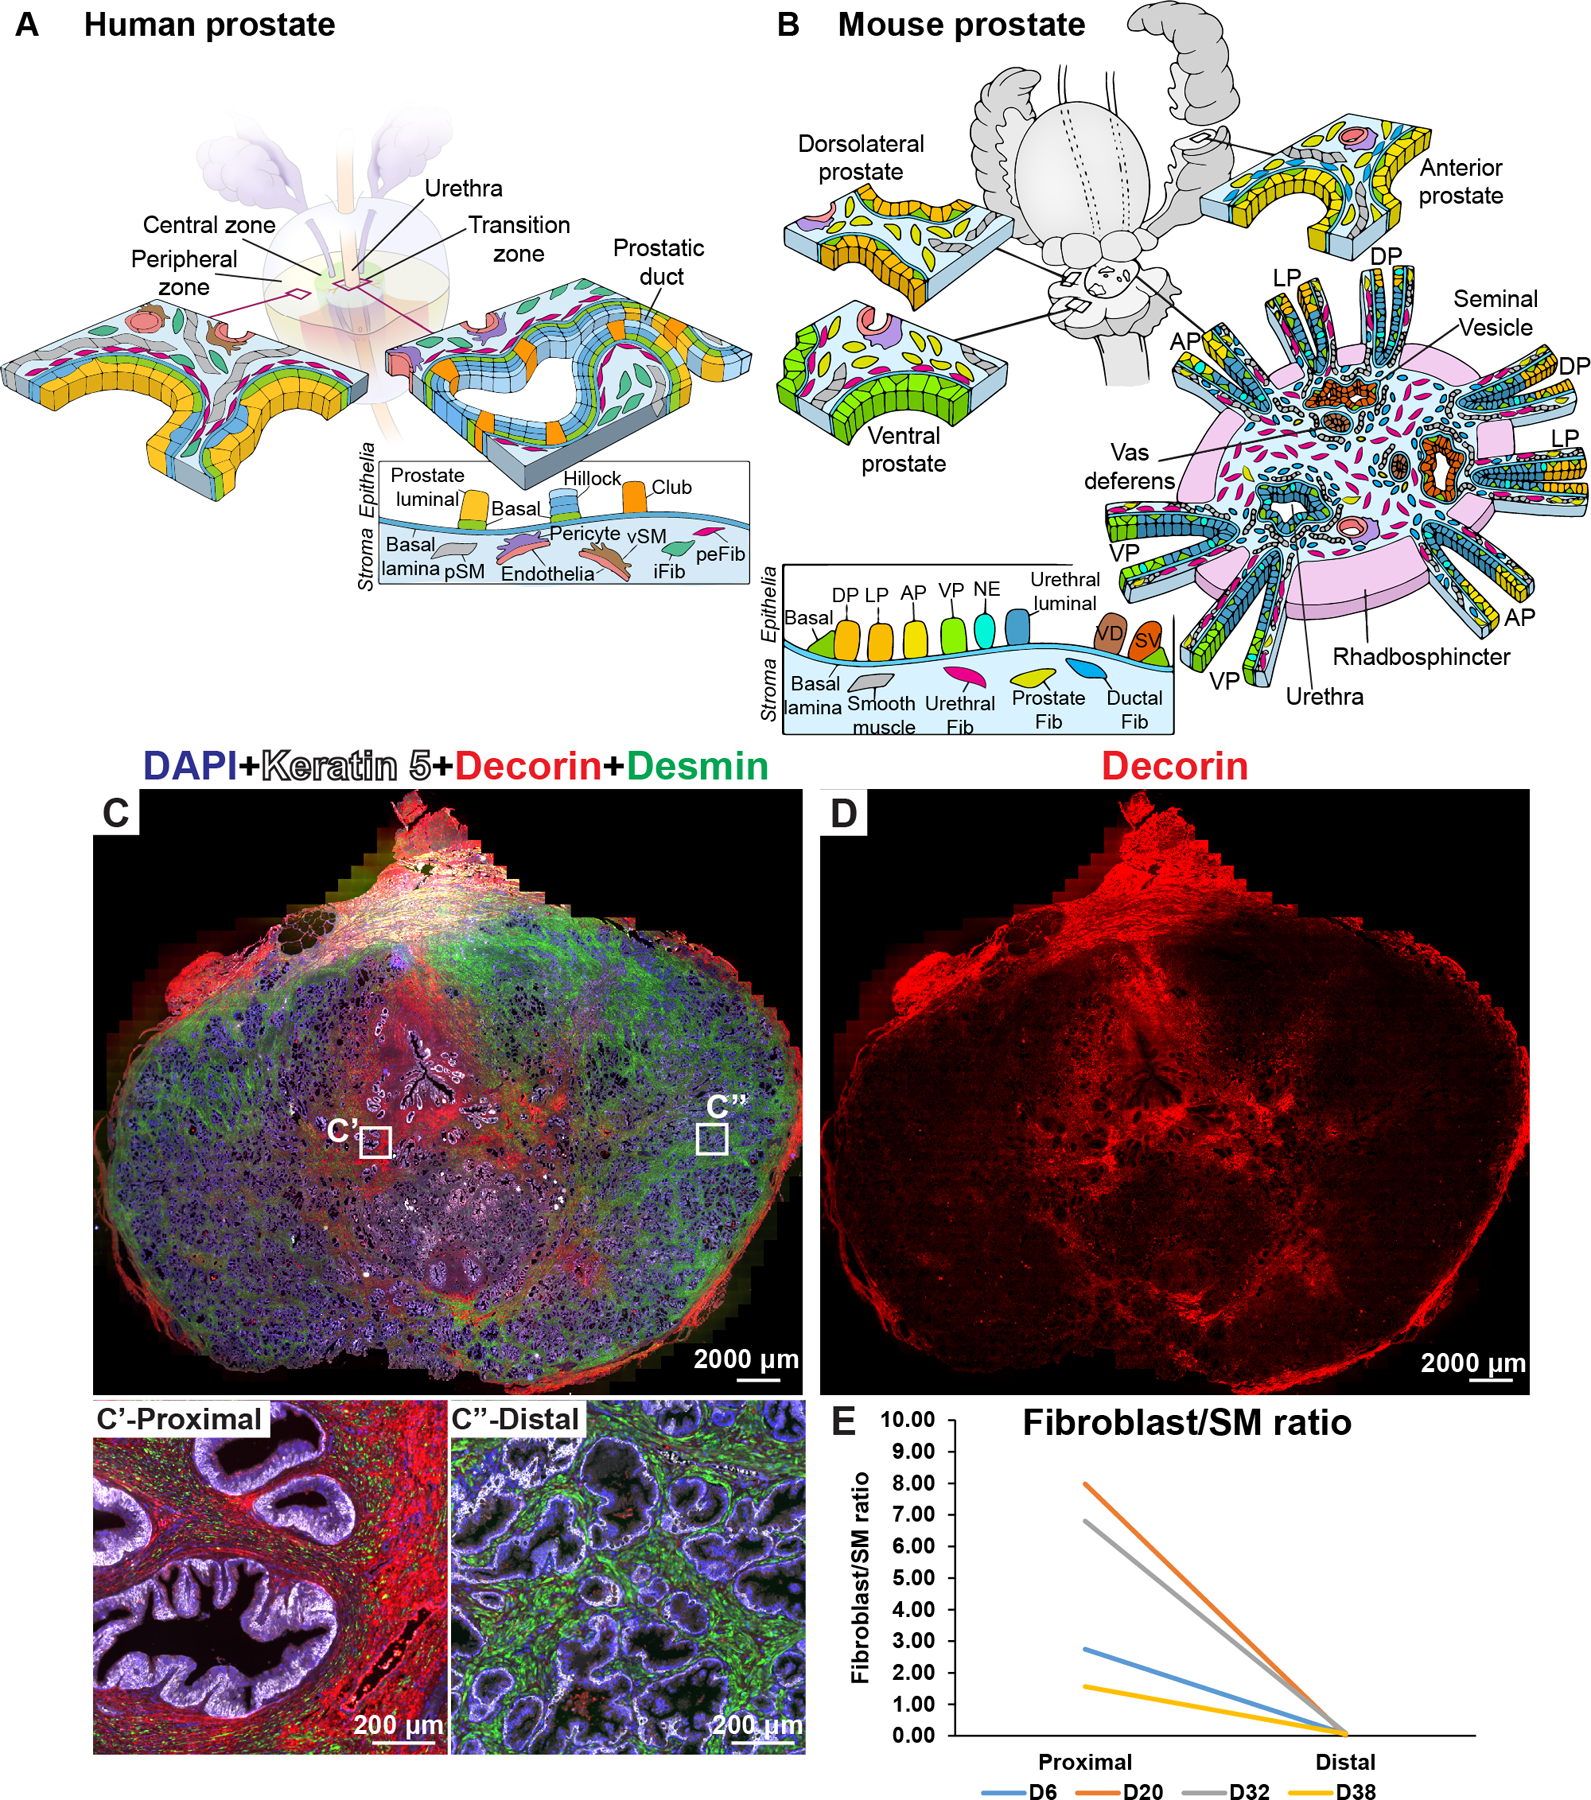
Figure 3. Fibroblast density and distribution in the prostate.

(A) Illustration depicting stromal subtypes in the human prostate. (B) Illustration depicting distribution of mouse stromal subtypes across the prostate lobes and prostatic urethra. (C) Whole mount section through a young normal prostate labeled with antibodies to Desmin (in green, labels prostate smooth muscle), Decorin (in red, labels fibroblasts) and Keratin 5 (in white, labels basal epithelial cells). DAPI (in blue) labeled nuclei. Magnified insets from (C) correspond to the proximal region (C’) and the distal region (C”) of the prostate. (D) Red channel corresponding to Decorin immunostaining isolated from image (C) to visualize fibroblast density differences. (E) Fibroblast to smooth muscle ratio in the proximal and distal region from four donor prostates. See also supplementary material, Figure S3, S4.
