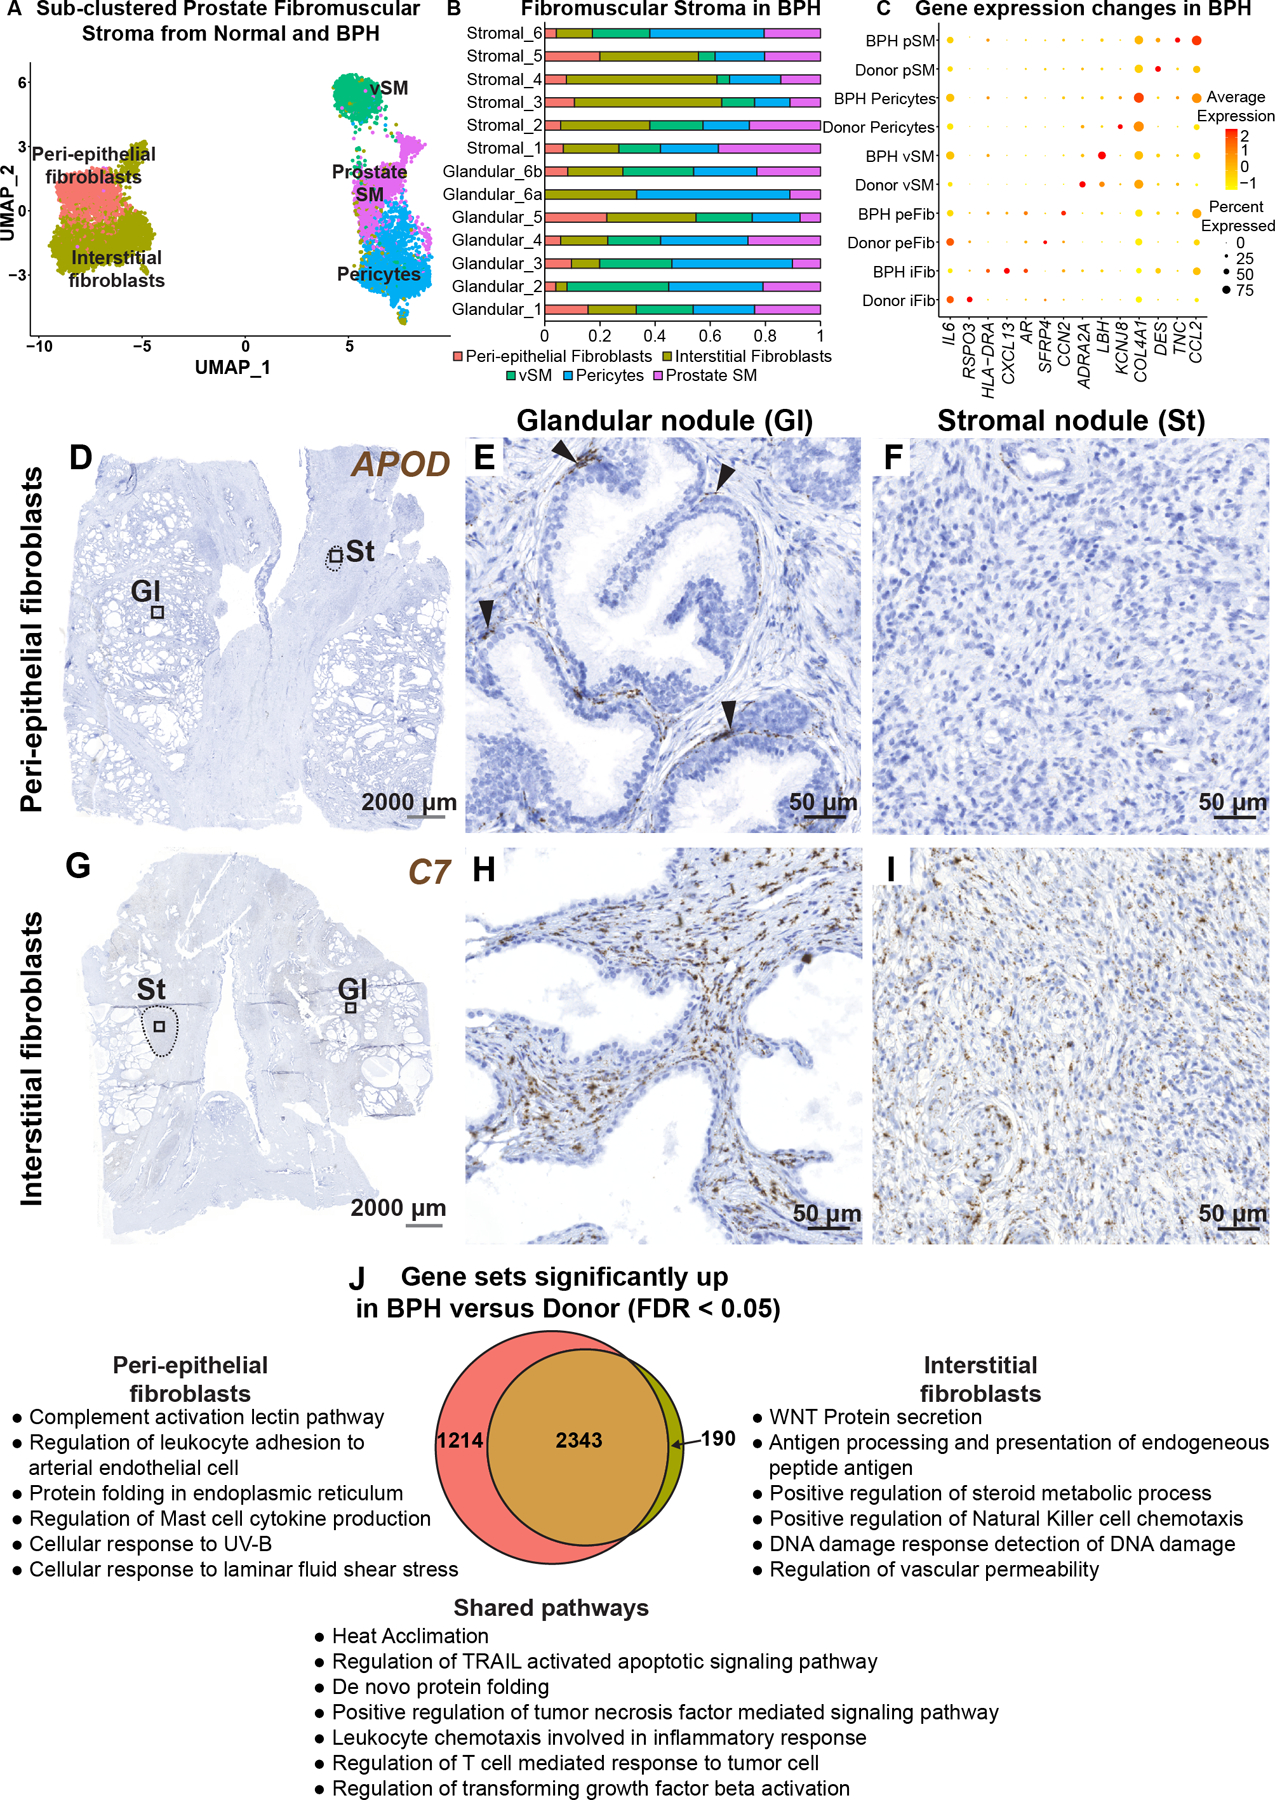
Figure 4. Fibroblasts in human benign prostatic hyperplasia (BPH).

(A) Subsetted fibromuscular stroma from normal human prostate samples (n=3 prostate donors) and BPH samples (n=6 BPH patients). (B) Fibromuscular stromal composition of glandular (n=6) and stromal samples (n=6) from six BPH patients. (C) Dot plot of selected differentially regulated genes (padj < 0.05) in BPH versus normal. (D) Section through BPH tissue labeled with probes to the peri-epithelial fibroblast marker APOD (in brown). Magnified images of distinct histologic phenotypes from (D) corresponding to (E) glandular nodule and (F) stromal nodule. Black arrowheads indicate APOD+ fibroblasts in the peri-epithelial compartment. (G) Section through BPH tissue labeled with probes to the interstitial fibroblast marker C7 (in brown). Magnified images of distinct histologic phenotypes from (G) corresponding to (H) glandular nodule and (I) stromal nodule. Grey scale bar represents 2000 microns. Black scale bar represents 50 microns. Black dotted lines outline stromal nodules. (J) Quantitative Set Analysis for Gene Expression (QuSAGE) performed for each fibroblast subtype comparing donor (normal) and BPH (diseased). Significant gene sets (false discovery rate < 0.05) were subsetted to obtain unique and shared gene sets upregulated by the fibroblast subtypes in BPH. See also supplementary material, Figure S5.
