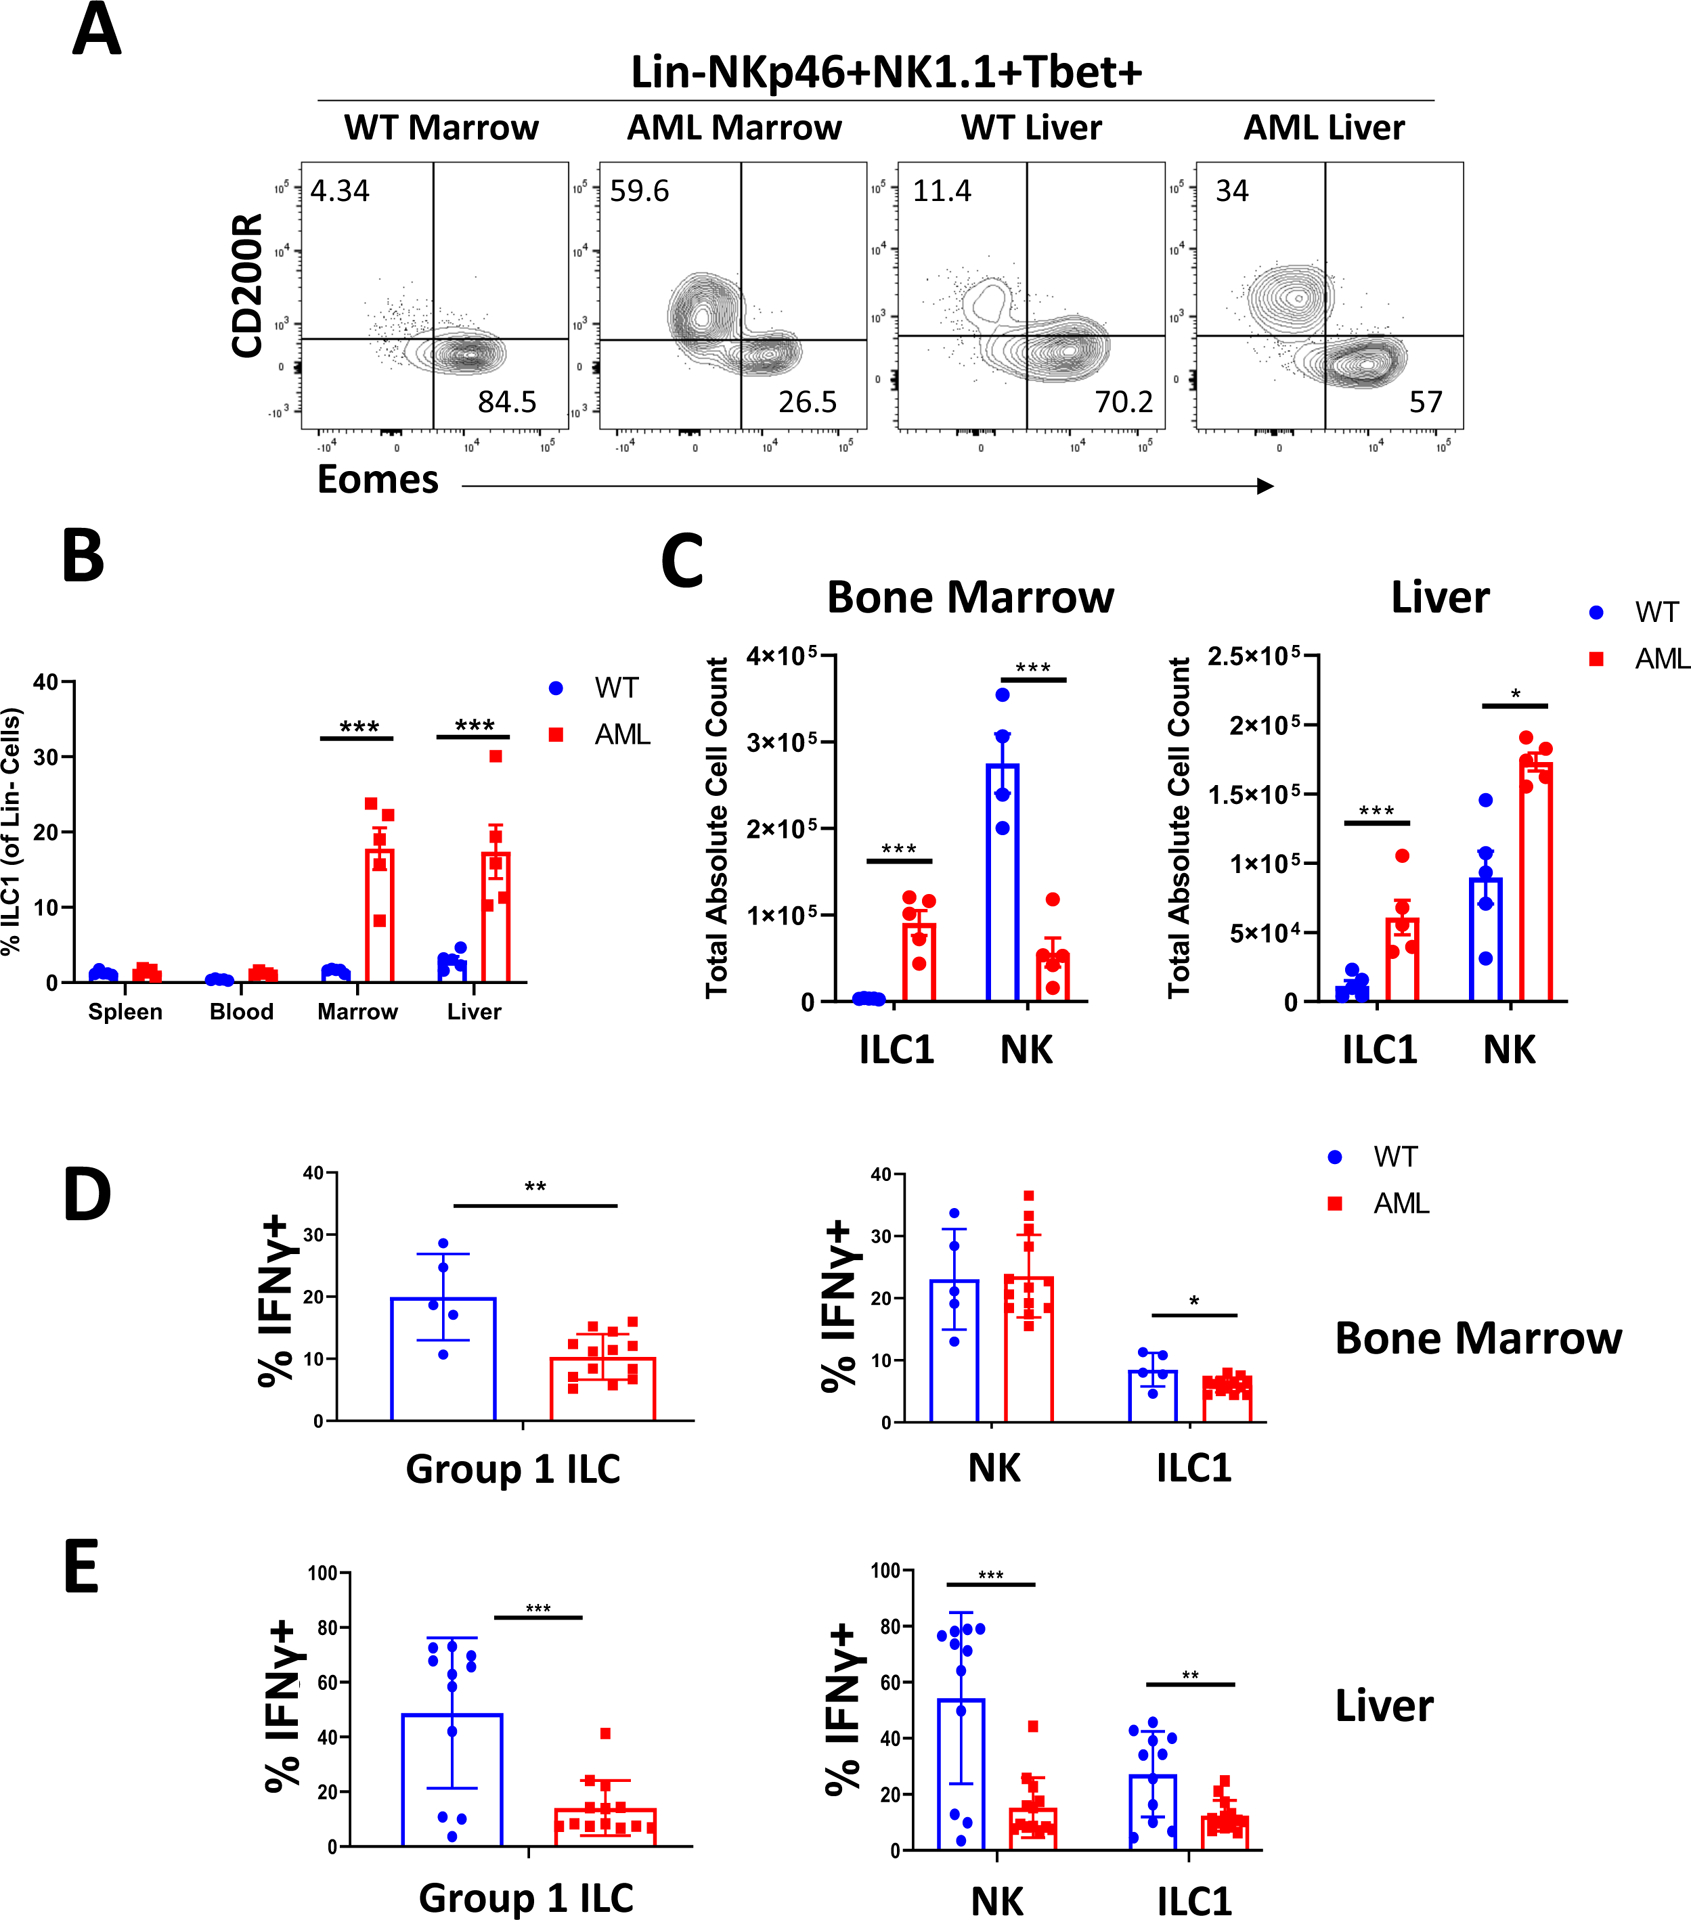
Figure 1: ILC1s are expanded in the marrow and liver of leukemic mice.

A) Representative flow plots of Eomes vs CD200R expression among Lin-NKp46+NK1.1+Tbet+ cells in the liver and bone marrow of WT and transplant leukemic mice.
B) Quantification of ILC1 frequency (among total Lin- cells) across spleen, blood, bone marrow, and liver.
C) Absolute counts for ILC1s and NK cells in the bone marrow and liver for WT and transplant leukemic mice.
n=5 WT, n=5 AML, *p<0.05, ***p<0.001. Error bars represent ±SD.
D) Representative flow plots and summary data of IFNγ expression for NK cells and ILC1s in the marrow of WT and transplant leukemic mice.
E) Summary data of IFNγ production among liver Group 1 ILCs. Data points were pooled from two independent experiments.
n=5 (BM) or 11 (Liver) WT, n=13 AML, *p<0.05, **p<0.01. Error bars represent ±SD.
