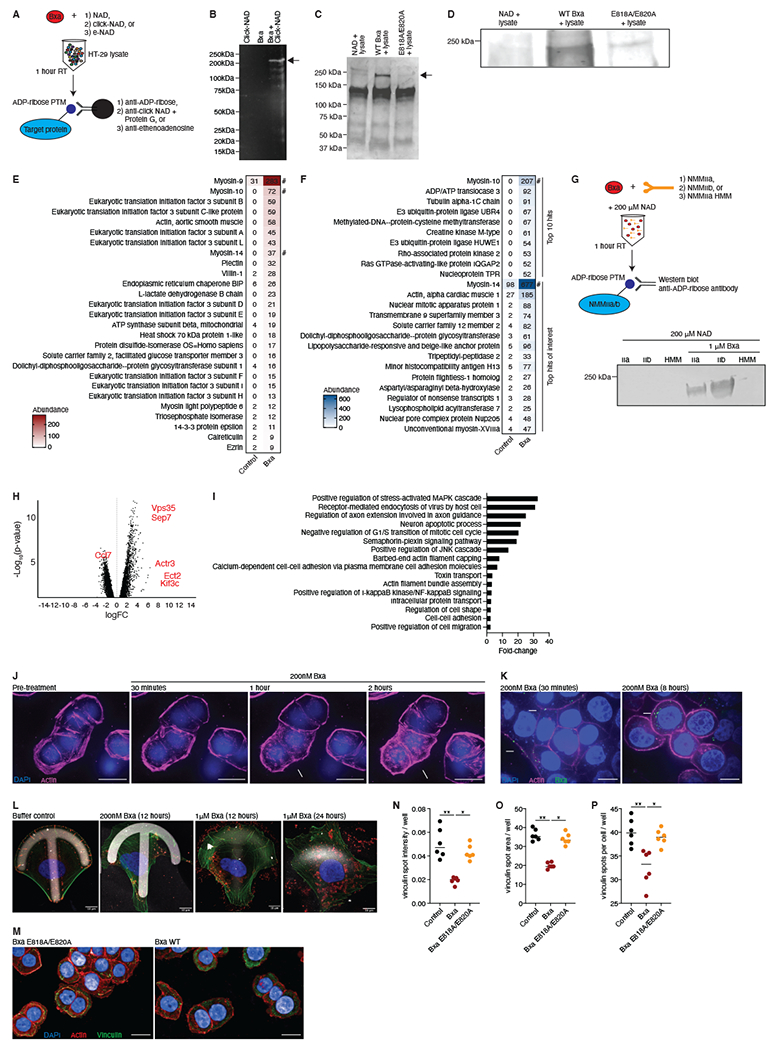
Figure 4: Bxa targets non-muscle myosin II proteins and remodels the actin cytoskeleton in epithelial cells.

A) Schematic of immunoprecipitation methods utilized to discover the Bxa target protein. B) Proteins immunoprecipitated with a click-NAD antibody from HT-29 cell lysates treated with click-NAD alone (left), Bxa alone (middle) or Bxa plus click-NAD (right). Representative of 2 independent experiments. C) Proteins immunoprecipitated with an anti-ADP-ribose antibody from HT-29 cell lysates treated with NAD alone (left), Bxa plus NAD (middle) and the Bxa E818A/E820A mutant plus NAD (right). Representative of 4 independent experiments. In (B) and (C) protein masses of the ladder are shown, and arrows point to the dominant band seen at ~230kDa. D) Western blot using the gel in (C) and an anti-ADP-ribose antibody. Bands shown were the only major bands detected in the 150-250 kDa region. Representative of 4 independent experiments. Proteins detected using mass spectrometry on the Bxa plus NAD elution (right) compared to the NAD only elution (left) in the immunoprecipitations using E) anti-ADP-ribose and F) anti-click-NAD. Values are the relative abundance by area under the curve of the peptides from the identified proteins. A # indicates the most abundant myosin proteins. Representative of 2 independent experiments. G) Schematic of the method to test direct ADP-ribosylation of NMMII proteins. The resulting western blot is shown, with IIa, IIb and HMM indicating the NMMII isoform used in each well with (right 3 wells) or without (left 3 wells) purified Bxa. H) Genes in murine epithelial monolayers differentially expressed after 4h of Bxa treatment. Genes of interest are in red. The x-axis is the log of the fold-change (FC) and the y-axis is the −log10 of the p-value (Benjamini-Hochberg, FDR-adjusted). Representative of 2 independent experiments, n=3. I) The most significantly upregulated pathways in Bxa-treated monolayers, based on GSEA of each gene that was significantly upregulated (FC>2, FDR <0.01) after Bxa treatment. The x-axis is the fold-change of the pathway over expected values from a control-treated sample. J) Images from time-lapse microscopy of HT-29 cells treated with Bxa. DAPI (blue) shows nuclei and an SiR stain (pink) shows actin. Arrows indicate cells with actin-cytoskeleton disruption; scale bar=20μm. K) HT-29 cells treated with Bxa. Actin (pink), nucleus (blue) and Bxa (green) are shown. 40X magnification, scale bar=50μm. Arrows indicate Bxa bound to the outside of the cell and in the cytosol. L) U2OS cells cultured in a micropattern, crossbow format to test for cell migration and changes in focal adhesions after Bxa treatment. 100X magnification, scale bar=10μm. Actin (green), nucleus (blue) and Bxa or paxillin control (red) are shown. M) HT-29 cells treated with Bxa WT or Bxa E818A/E820A for 18h. Actin (red), nucleus (blue) and vinculin (green) are shown. 40X magnification, scale bar=50μm. Arrows indicate differences in pattern, intensity and shape of vinculin staining. A set of 25 images from 6 biological replicates in 2 independent experiments were quantified for N) vinculin spot intensity per well, O) vinculin spot area per well and P) number of vinculin spots per cell, per well. All microscopy images are representative of at least 2 independent experiments. *p<0.05; **p<0.01. Lines represent mean +/− SEM. See also Fig. S3, File S3 and Videos S1–4.
