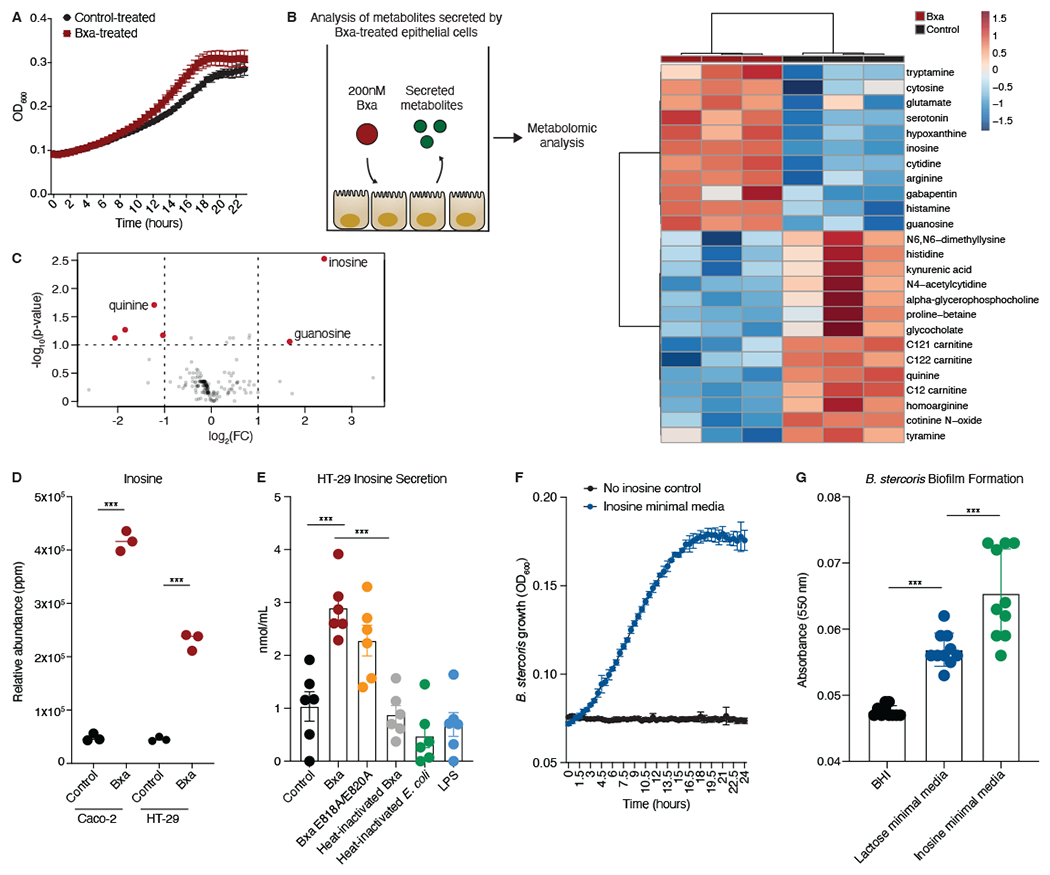
Figure 5: Bxa induces epithelial cells to secrete inosine, which Bacteroides can use as a sole carbon source.

A) Growth curve of B. stercoris cultured with Bxa- or control-treated HT-29 cell media (n=3 biological replicates with 2 technical replicates). B) Schematic of the assay performed to analyze metabolites secreted by Bxa-treated HT-29 epithelial cells. Clustering of the top 25 differentially abundant metabolites increased (red) or decreased (blue) on a log2 scale after Bxa treatment. C) Observed metabolite peaks that were able to be annotated, with log2 fold-change (FC) on the x-axis and −log10 of the p-value (Benjamini-Hochberg) on the y-axis. Metabolites in red were the most significantly changed (p<0.01, FC>2). D) Relative abundance of inosine in HT-29 and Caco-2 supernatants, with and without Bxa treatment. ***p<0.001; Benjamini-Hochberg, FDR adjusted. E) Inosine concentration in the supernatant of HT-29 cells treated with a buffer control, Bxa, Bxa E818A/E820A, heat-inactivated Bxa, heat-inactivated E. coli or LPS for 4h. ***p<0.001; one-way ANOVA. Representative of 2 independent experiments, n=6. F) Growth curve in minimal media with no carbon source (black) or inosine as the sole carbon source (blue). Representative of 4 independent experiments, n=3-6. G) Absorbance after a biofilm assay was performed to measure the relative number of bacteria capable of adhering to the bottom of the plate after 72h of growth in BHI media, lactose minimal media and inosine minimal media. ***p<0.001; one-way ANOVA. Representative of 2 independent experiments, n=10. Error bars represent mean +/− SEM. See also Fig. S4 and File S3.
