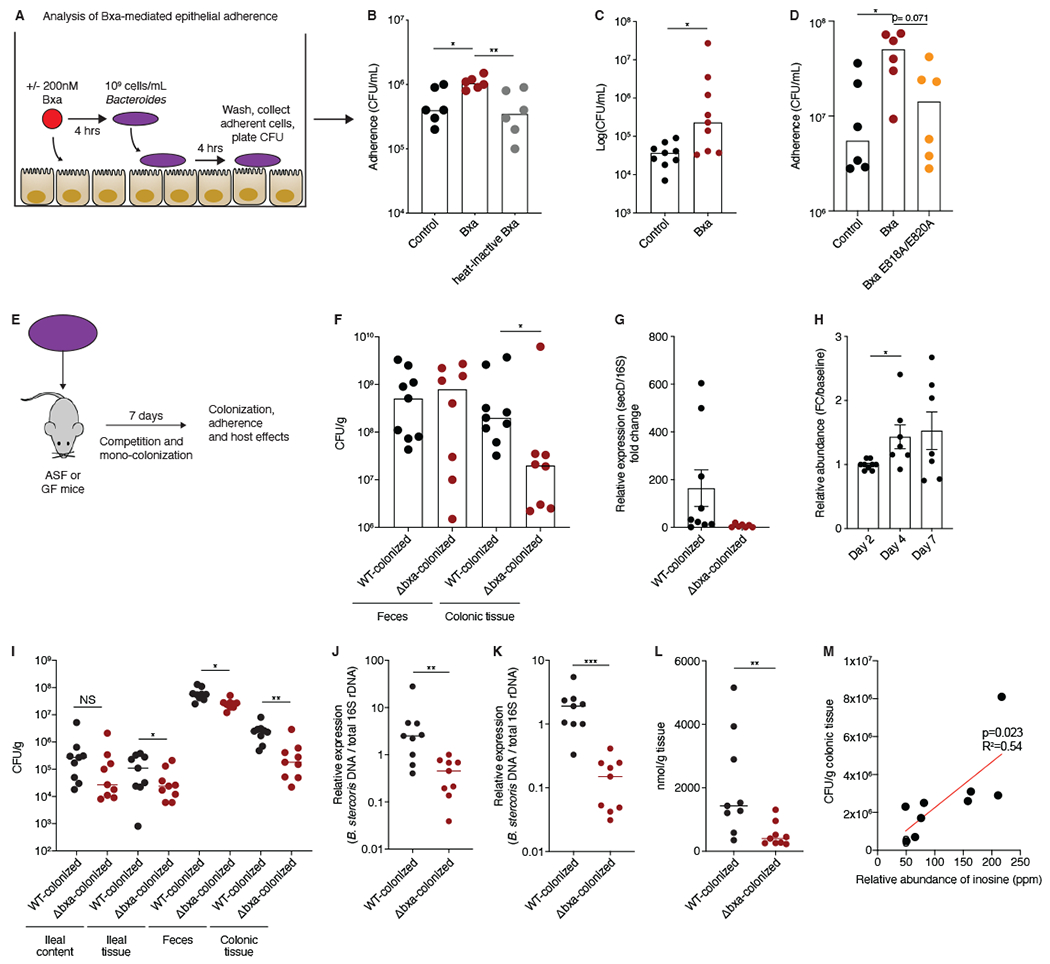
Figure 6: Presence of bxa in Bacteroides enhances bacterial adherence to epithelial cells and colonization of the intestinal epithelium.

A) Schematic of the method used to test whether Bacteroides adherence to epithelial cells increases with Bxa pretreatment. B) Number of B. thetaiotaomicron colony forming units (CFUs) in control-treated, Bxa-treated or heat-inactivated Bxa-treated HT-29 cells. Number of B. stercoris CFUs in C) control- or Bxa-treated HT-29 cells and D) control-, Bxa- or E818A/E820A-treated HT-29 cells. E) Schematic of protocol used with germ-free (GF) and ASF mice to understand colonization and a potential fitness benefit for bxa-encoding Bacteroides. Differences in mucosal-adherent colonic colonization F) of B. stercoris WT and Δbxa strains 7 days after mono-colonization in GF mice (n=8-9) and G) by qPCR measuring the relative expression of secD in WT and Δbxa B. stercoris 7 days after mono-colonization in GF mice (n=8-9). H) Relative abundance of the WT compared to Δbxa strain during a competition experiment in which each strain was administered to GF mice (n=7) at a 1:1 ratio. A higher number indicates more WT than Δbxa strain in the stool of mice. I) Differences in mucosal-adherent and luminal colonic or ileal colonization of WT and Δbxa B. stercoris 7 days after colonization in ASF mice (n=9). Quantification of WT and Δbxa B. stercoris colonization (7 days after each strain was administered once to ASF mice) using qPCR on J) ileal or K) colonic tissue DNA. Amplification of secD relative to 16S rRNA was quantified and compared. n=9 mice. L) Inosine concentration measured in colonic epithelial cells from the stool of ASF mice (n=9) colonized with WT or Δbxa B. stercoris. M) Correlation between relative inosine abundance measured using LC-MS in the stool of WT-colonized ASF mice and CFU counts from colonic tissue of the same mice (n=9). Statistical analyses were performed using the Mann-Whitney U-test for two comparisons or a one-way ANOVA for multiple comparisons, *p<0.05; **p<0.01; ***p<0.001. HT-29 adherence data is representative of 4 independent experiments. Mouse data is representative of 2 independent experiments. Error bars represent mean +/− SEM. See also Fig. S5.
