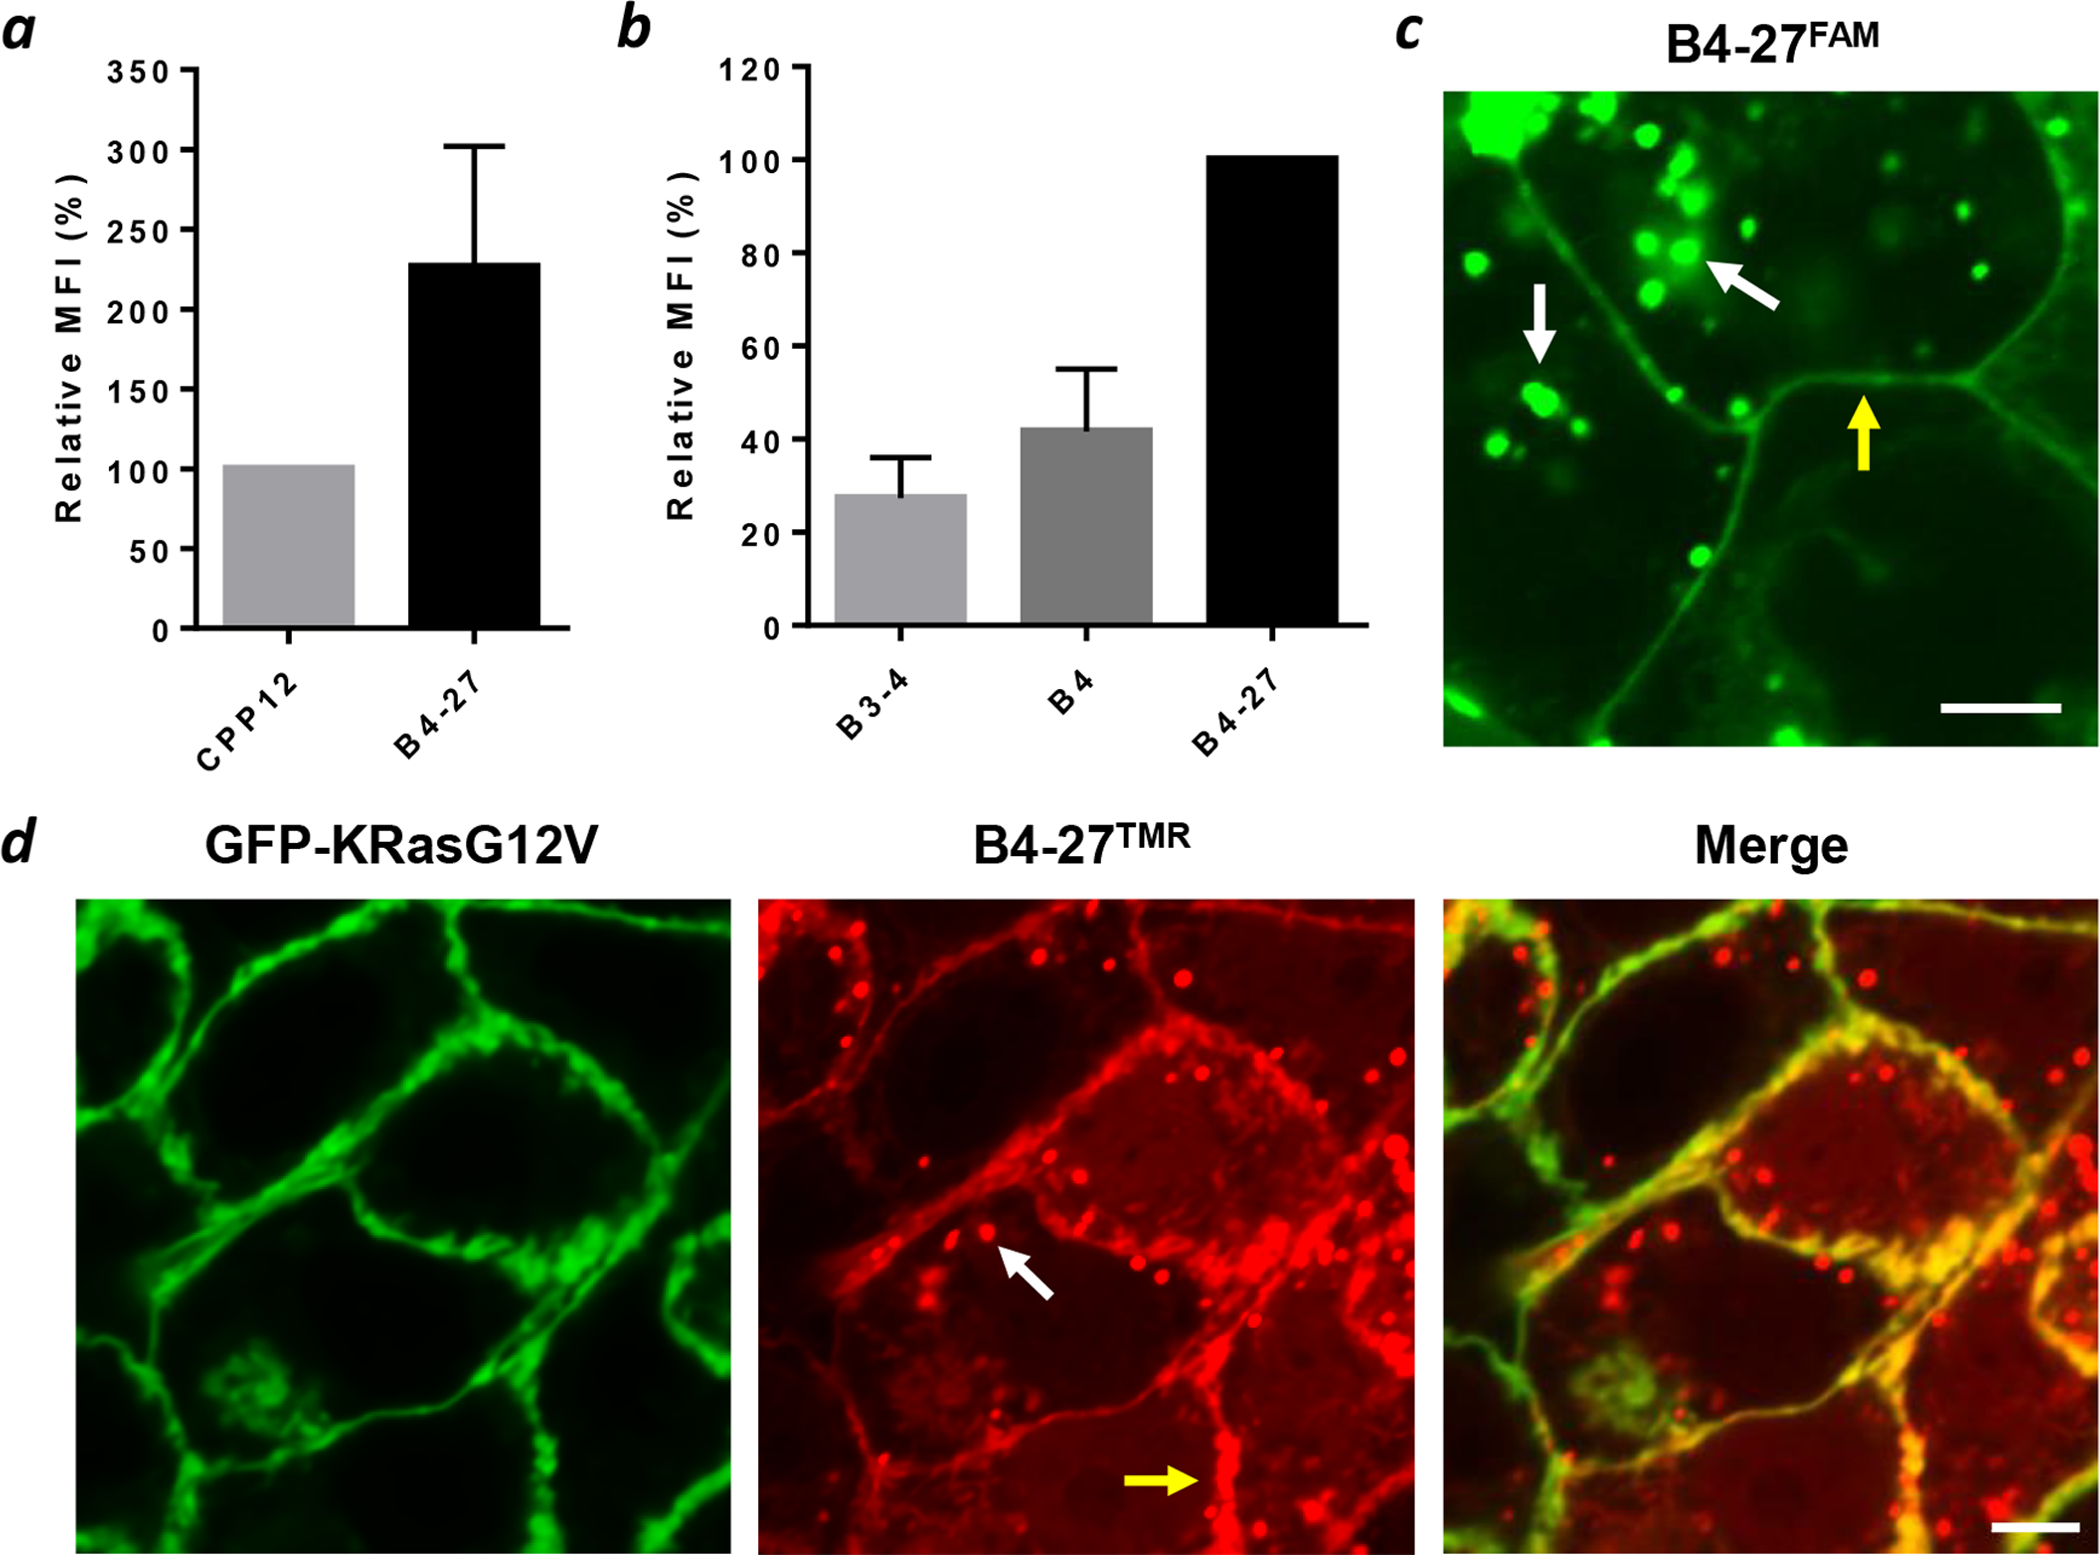
Figure 2.

Cellular entry and intracellular distribution of B4-27. (a) Flow cytometry analysis of HeLa cells after treatment with 5 μM CPP12FITC or B4-27FAM for 2 h in the presence of 1% FBS. Values reported represent the mean ± SD from 3 independent experiments (n = 3) and are relative to that of CPP12FITC (100%). (b) Flow cytometry analysis of HeLa cells after treatment with 5 μM B3-4FAM, B4FAM or B4-27FAM for 2 h in the presence of 1% FBS. Values reported represent the mean ± SD from 3 independent experiments (n = 3) and are relative to that of B4-27FAM (100%). (c) Live-cell confocal microscopic images of H358 cells after treatment with 3 μM B4-27FAM for 2 h in the presence of 1% FBS. (d) Co-localization of B4-27TMR (red) with GFP-KRasG12V (green) in MDCK cells stably expressing GFP-KRasG12V after treatment with 5 μM B4-27TMR for 2 h in the presence of 1% FBS. White arrows, putative endosomes; yellow arrows, plasma membrane; scale bars, 5 μm.
