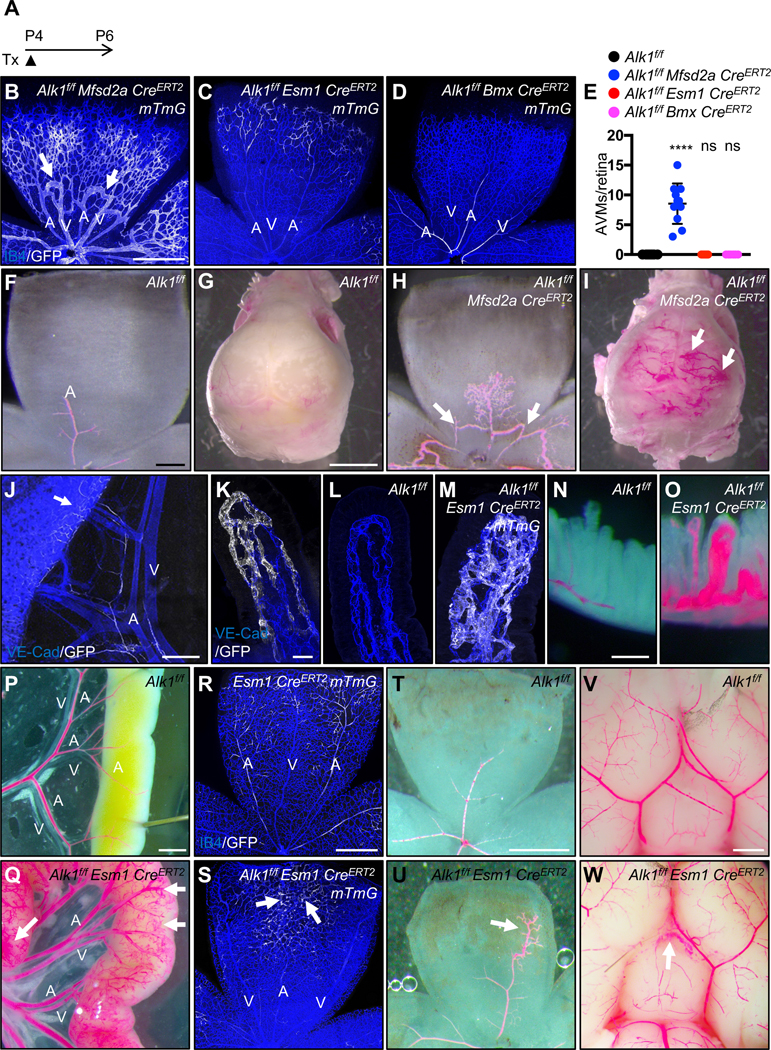
Figure 2. Capillary-venous loss of ALK1 leads to AVMs.

(A) Schematic representation of the experimental strategy used to delete Alk1 in mice (P4-P6). (B-D) P6 retina flat mount images labeled with IB4 (blue) and GFP (white) from Alk1f/f Mfsd2a CreERT2 mTmG (B), Alk1f/f Esm1 CreERT2 mTmG (C) and Alk1f/f Bmx CreERT2 mTmG pups (D) injected with 100 μg Tx at P4 and dissected at P6. White arrows indicate AVMs. (E) Quantification of AVM number. n = 6–11 mice per group. Error bars: SEM. **** P-value < 0.0001, ns: nonsignificant, One-way ANOVA with Sidak’s multiple comparisons test. (F-I) Vascular labeling with latex dye (red) of retinal and brain vessels in Alk1f/f (F and G) and Alk1f/f Mfsd2a CreERT2 (H and I) P6 pups. White arrows indicate AVMs. (J and K) GFP (white) and VE-Cad (blue) staining of mesentery and gastrointestinal (GI) tract (J) and lacteals (K) from P14 Esm1 CreERT2 mTmG. 100 μg Tx was injected at P4. An arrow indicates Esm1 positive capillary ECs (J). (L and M) VE-Cad (blue) and GFP (white) staining of jejunum lacteals from P14 Alk1f/f (L) and Alk1f/f Esm1 CreERT2 mTmG (M). (N-Q and T-W) 100 μg Tx was injected at P4 and dissected at P12. Vascular labeling with latex dye (red) of villi, GI tracts, retinas and brains in Alk1f/f (N,P,T and V) and Alk1f/f Esm1 CreERT2 (O, Q, U and W) P12 pups. (R and S) 100 μg Tx was injected at P4 and dissected at P12 (R and S). IB4 (blue) and GFP (white) staining of retinal flat mounts from Esm1 CreERT2 mTmG (R) and Alk1f/f Esm1 CreERT2 mTmG (S) P12 mice. An arrow indicates vascular malformations (Q, U and W). A: artery, V: vein, Scale bars: 500 μm (B-D), 200 μm (F and H), 2 mm (G and I). 400 μm (J), 25 μm (K-M), 200 μm (N and O), 1 mm (P-G and V-W), 500 μm (R-U), 200 μm.
