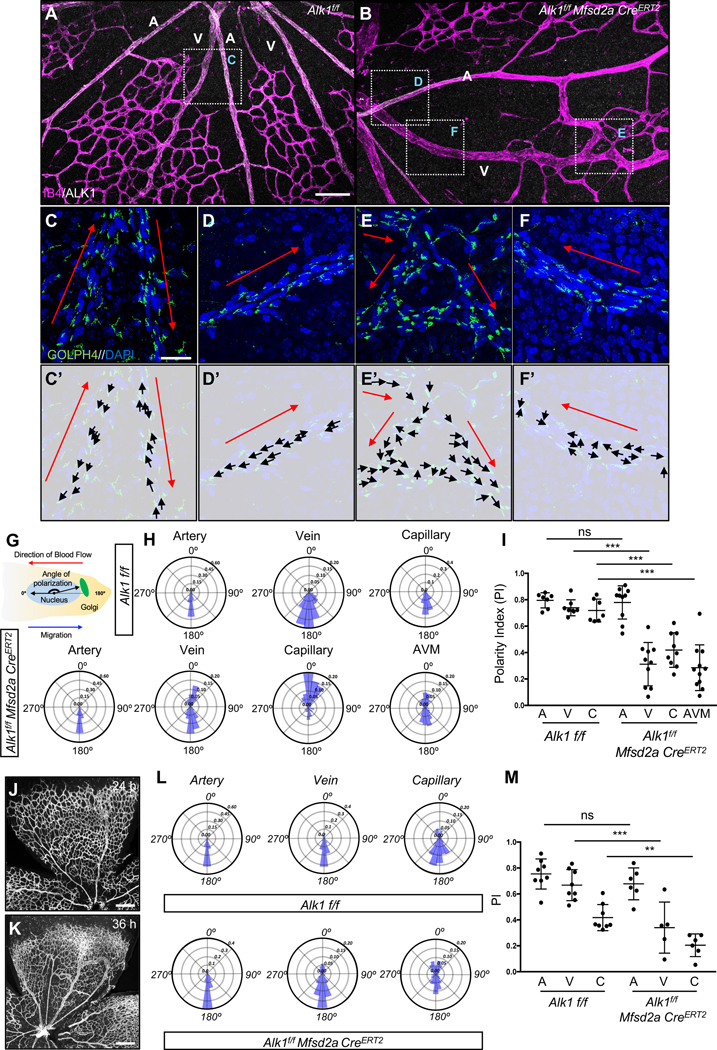
Figure 3. ALK1 controls cell polarization against the blood flow direction.

(A-B) IB4 (Magenta) and ALK1 (white) staining of retinal flat mounts from Alk1f/f (A) and Alk1f/f Mfsd2a CreERT2 (B) pups injected with 100 μg Tx at P4 and dissected at P6. (C-F) Higher magnification of insets in A and B. GOLPH4 (green) and DAPI (blue) staining of retina flat mounts. Red arrows indicate the blood flow direction. (C’-F’) Background images from Figure 2C–2F and corresponding polarity vectors (black arrows). (G) The polarity axis of each cell was defined as the angle between the direction of blood flow and the cell polarity axis, defined by a vector drawn from the center of the cell nucleus to the center of the Golgi apparatus. (H) Angular histograms showing the distribution of polarization angles of ECs in the artery, vein and capillaries from Alk1f/f and artery, vein, capillary and AVM from Alk1f/f Mfsd2a CreERT2 mouse retinas. n = 7–11 retinas. (I) polarity index (PI) box plots of ECs from artery, vein and capillary from Alk1f/f and artery, vein, capillary and AVM from Alk1f/f Mfsd2a CreERT2 P6 retinas. n = 7–11 retinas. (J and K) IB4 (gray) staining of retinal flat mounts from Alk1f/f Mfsd2a CreERT2 pups injected with 100 μg at P4 and dissected after 24 h (P5) (J) and 36 h (P5.5) (K). (L) Angular histograms showing the distribution of polarization angles of ECs in the artery, vein and capillary from Alk1f/f and Alk1f/f Mfsd2a CreERT2 P5 retinas at 24 h after Tx injection. (M) PI box plots of ECs from artery, vein and capillary from Alk1f/f and Alk1f/f Mfsd2a CreERT2 retinas at 24 h after Tx injection. n = 5–8 retinas/group. Error bars: SEM. **P-value < 0.01, ***P-value < 0.001, ns: nonsignificant, Two-way ANOVA with Tukey’s multiple comparisons test. Scale bars: 100 μm (A-B), 20 μm (C-F) and 500 μm (J-K)
