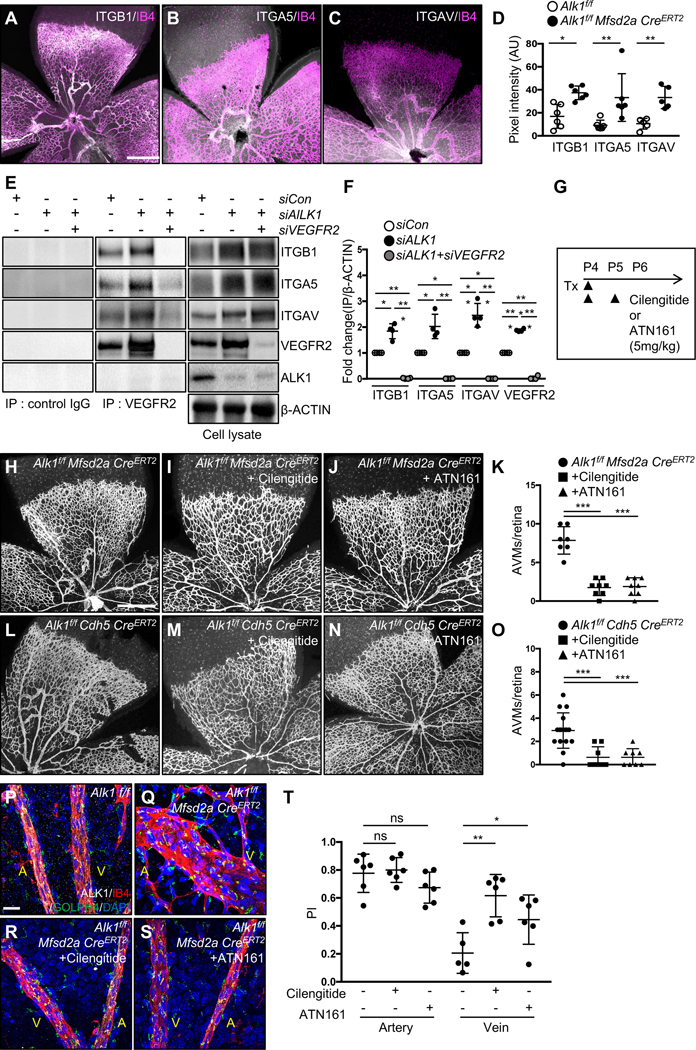
Figure 5. Integrin inhibition prevents AVM formation in Alk1 mutant retinas.

(A-C) IB4 (Magenta) and ITGB1(A, white), ITGA5 (B, white) or ITGAV (C, white) staining of retinal flat mounts from P8 Alk1f/f Mfsd2a CreERT2 pups. (D) Quantification of ITGB1, ITGA5 and ITGAV in P8 Alk1f/f Mfsd2a CreERT2 retinas. (E) VEGFR2 immunoprecipitation in siCon, siALK1 or siALK1+siVEGFR2 HUVECs and western blot analysis for ITGB1, ITGA5, ITGAV and ALK1. VEGFR2, ITGB1, ITGA5, ITGAV, ALK1 and β-ACTIN expression from the total cell lysates are shown as loading controls. Rabbit IgG was used as control. (F) Quantification of ITGB1, ITGA5 or ITGAV levels from immunoprecipitation normalized to β-ACTIN from total cell lysates. *P<0.05, **P<0.01, ***P-value < 0.001, One-way ANOVA with Sidak’s multiple comparisons test. (G) Experimental strategy to assess the effects of integrin inhibitors in Alk1 deleted retinas. Arrowheads indicate the time course of Tx (100 μg) and cilengitide (5mg/kg), ATN161 (5mg/kg) or vehicle administration. (H-J and L-N) IB4 staining of P6 retinal flat mounts from Alk1f/f Mfsd2a CreERT2 (H-J) or Alk1f/f CDH5 CreERT2 (L-N) injected with cilengitide (I and M) or ATN161 (J and N) at P4 and P5. (K and O) Quantification of the AVM number. Each dot represents one retina. n = 7–16 retinas per group. Error bars: SEM. ***P-value < 0.001, One-way ANOVA with Sidak’s multiple comparisons test. (P-S) IB4 (Magenta), ALK1 (white), GOLPH4 (green) and DAPI (blue) staining of retina flat mounts from Alk1f/f (P), Alk1f/f Mfsd2a CreERT2 (Q), Cilengitide (R) or ATN161 (S) injected Alk1f/f Mfsd2a CreERT2 pups. A: artery, V: vein, (T) PI box plots of ECs from artery and vein from Alk1f/f Mfsd2a CreERT2 injected cilengitide or ATN161 retinas. n=5–8 retinas/group. Error bars: SEM. *P-value < 0.05, **P-value < 0.01, ns: nonsignificant, One-way ANOVA with Sidak’s multiple comparisons test. Scale bars: 500 μm (A-C, G-I and K-M), 20 μm (P-S).
