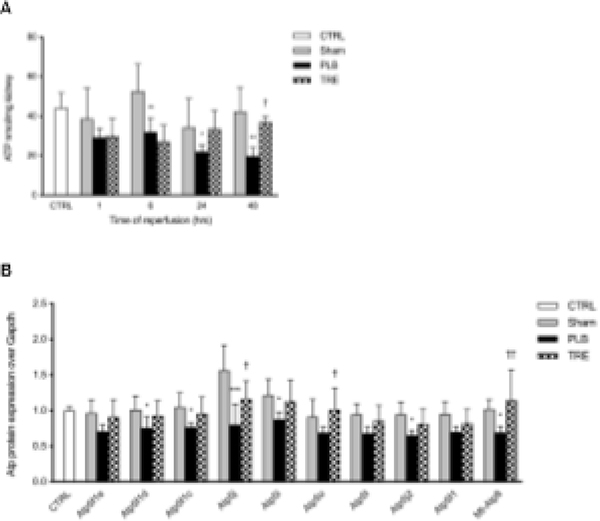
Figure 3. Treprostinil restores renal ATP and ATP synthase levels.
(A) Renal ATP levels at 1, 6, 24, and 48-hour after reperfusion measured by bioluminescent assay; (B) ATP synthase subunits at 48-hour post-reperfusion measured by SWATH-MS based proteomics, normalized to Gapdh, and expressed as a fold-change over control. Data are represented as mean ± SD; *p<0.05, **p<0.01, ***p<0.001 vs. sham, †p<0.05, ††p<0.01, †††p<0.001 vs. placebo (n = 3–5/group). Two-way ANOVA, Tukey’s multiple comparison test. ATP: adenosine triphosphate; SWATH-MS: Sequential windowed acquisition of all theoretical fragment ion mass spectra; Atp5f1: ATP synthase F(0) complex subunit B1; Atp5f1c: ATP synthase subunit gamma; Atp5f1d: ATP synthase subunit delta; Atp5f1e: ATP synthase subunit epsilon; Atp5i: ATP synthase subunit e; Atp5j: ATP synthase-coupling factor 6; Atp5fj2: ATP synthase subunit f; Atp5l: ATP synthase subunit g; Atp5o: ATP synthase subunit o; mt-Atp8: ATP synthase protein 8.

