
Fig. 3.
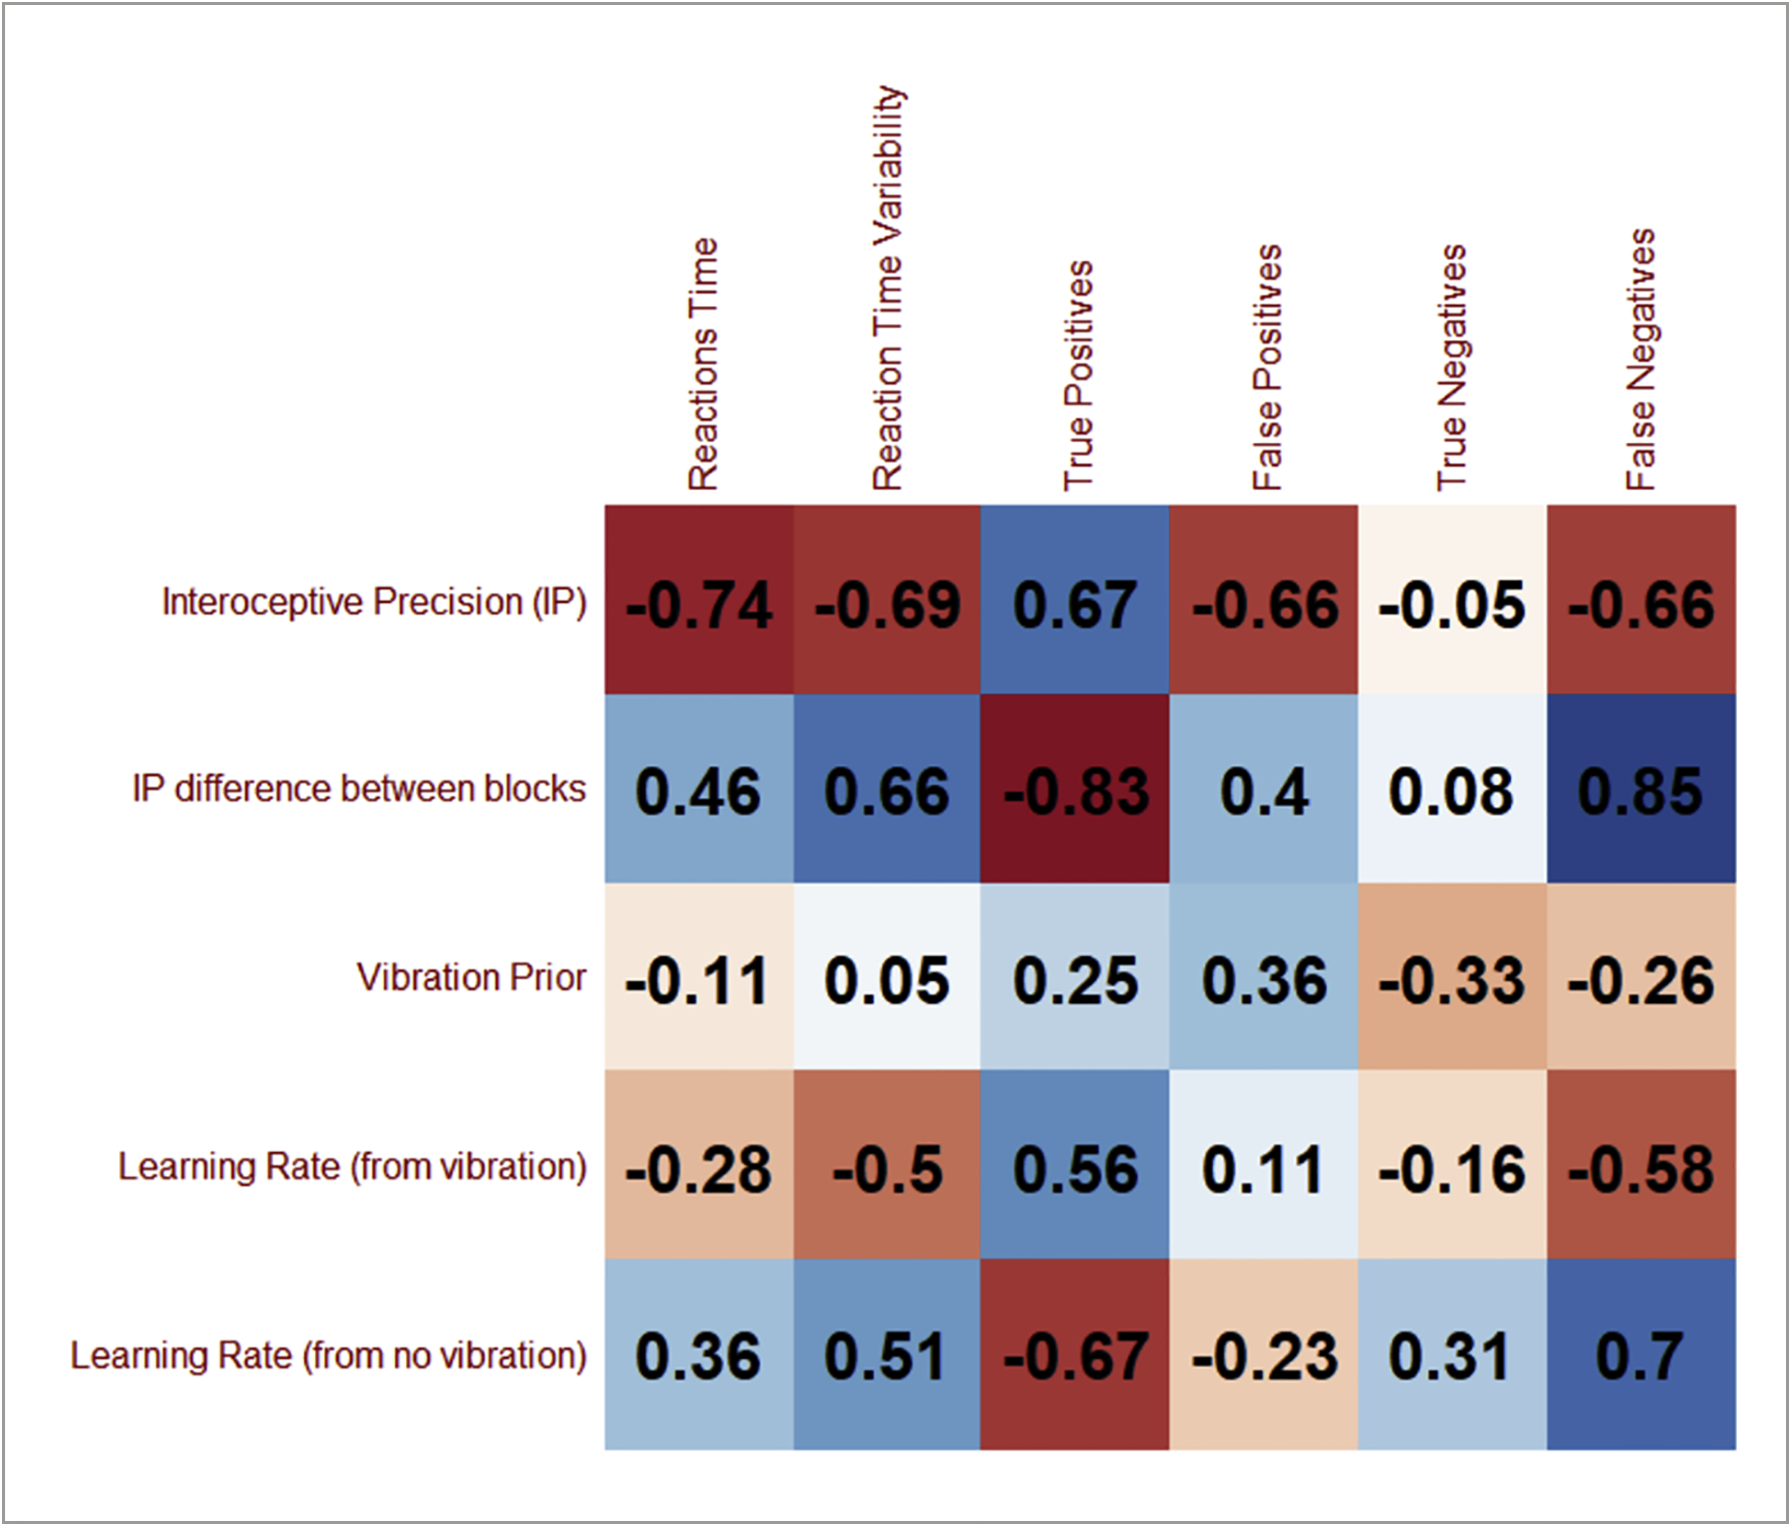
Pearson correlations between (log-transformed) parameter values and task reaction times (delay between vibration onset and button press), variability in reactions times, and behavioral accuracy measures (i.e., true/false positives/negatives). We do not show significance indicators as these were not hypothesis tests, but simply descriptive analyses to inform parameter face validity. For reference, a correlation (absolute value) of r > .31 corresponds to an uncorrected p-value less than .05.