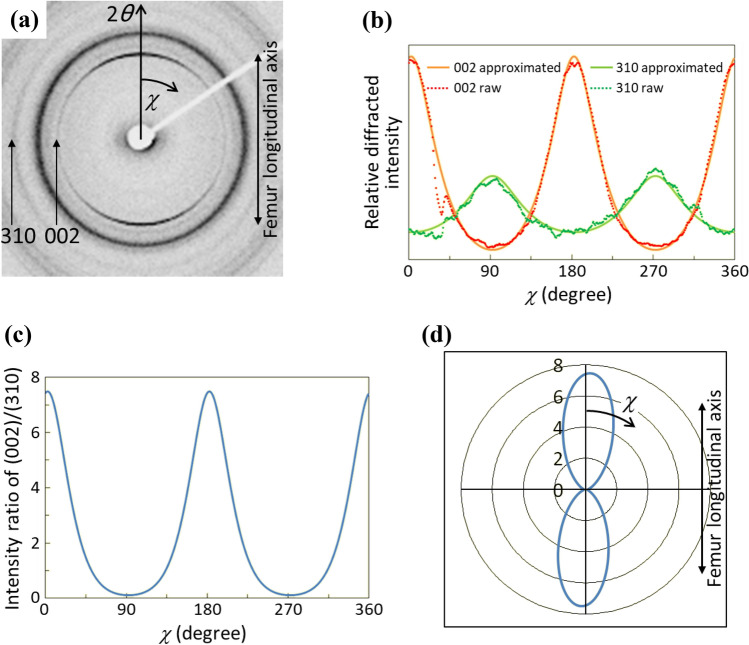
Fig. 2.
Quantitative analysis of the degree of preferential orientation of apatite c-axis along bone long axis. a Typical microbeam X-ray diffraction pattern obtained from thinned rat femur. Vertical direction in the image corresponds to femur long axis. b Variation in diffraction intensity of (002) and (310) plane of apatite as a function of azimuthal angle χ. c Distribution of the degree of preferential apatite c-axis orientation defined as the intensity ratio of (002) and (310) diffraction peak as a function of azimuthal angle χ. d Two-dimensional radar diagram of the apatite orientation. The radius represents the intensity ratio of (002)/(310)

