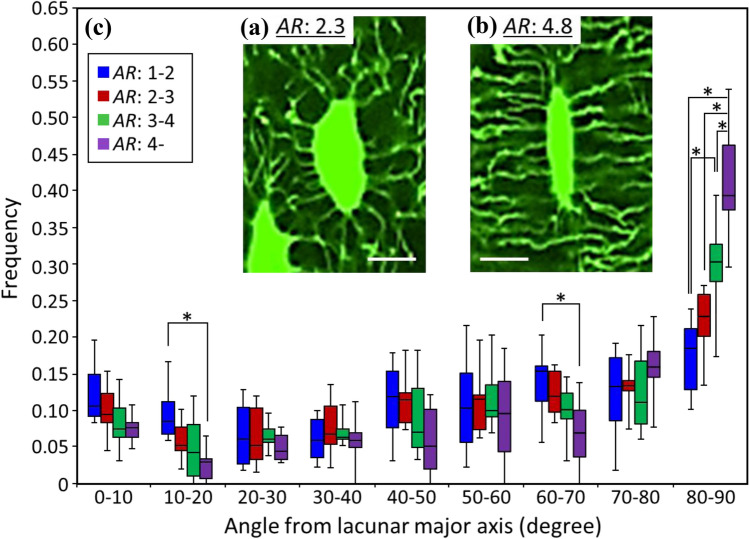
Fig. 3.
Osteocyte canalicular directionality distribution. a, b Representative confocal laser scanning microscopy images of the osteocyte lacunar-canalicular system acquired on a single z-plane. Scale bar: 10 μm. c Angular distribution of canaliculi that originated from the osteocyte lacuna with respect to the lacuna long axis, depending on the lacunar aspect ratio (n = 7). *Indicates statistical significance as determined by post hoc multiple comparison test (P < 0.05)

