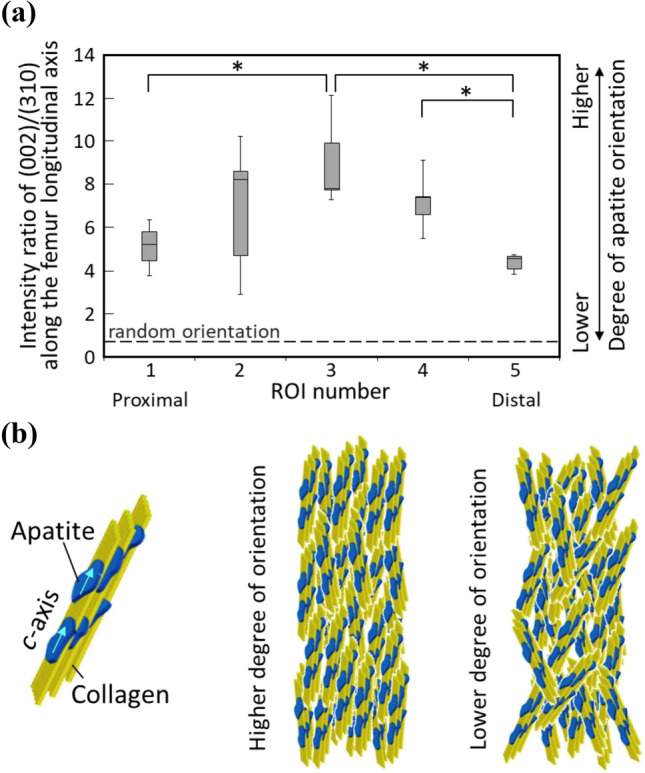
Fig. 5.

Analysis of ECM orientation. a Distribution of the degree of the preferential apatite c-axis orientation determined as the diffracted peak intensity ratio of (002)/(310) along the bone longitudinal axis (n = 7). The apatite orientation showed a statistically significant position dependency (P < 0.01) using a one-way ANOVA. *indicates statistical significance between ROIs determined by a post hoc multiple comparison test (P < 0.05). b Schematics of oriented apatite/collagen structure with higher and lower degree of orientation
