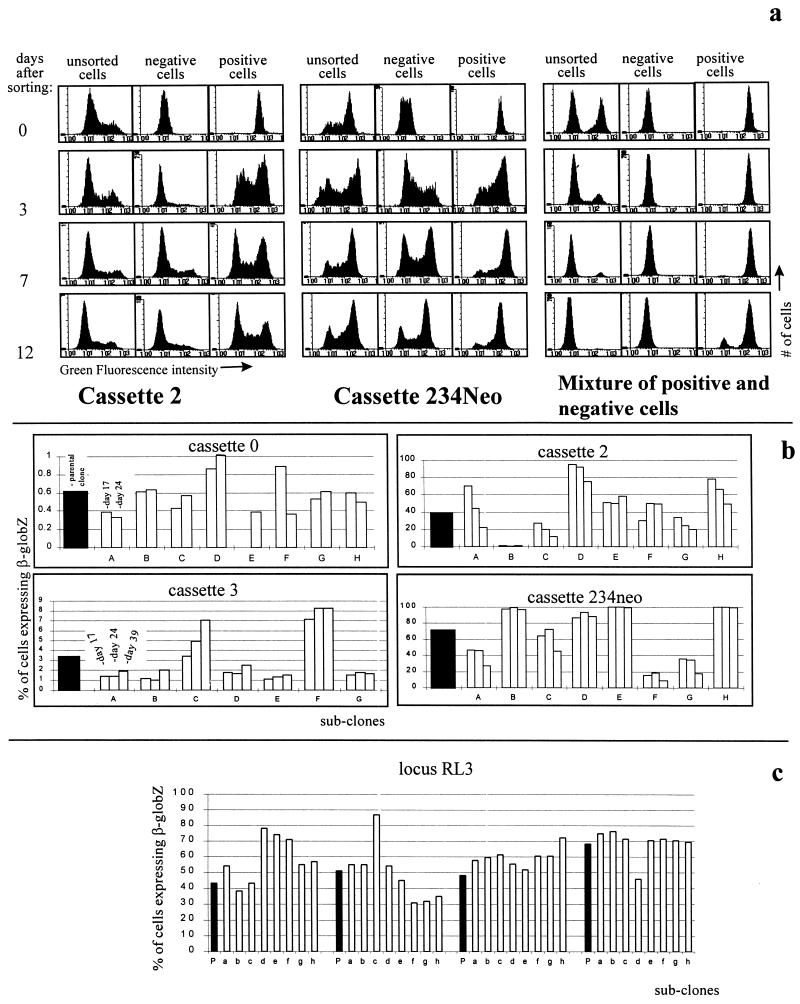
FIG. 2.
Mosaic expression patterns are caused by oscillations between activation and inactivation of the β-globZ gene. (a) Demonstration of oscillation by flow cytometry. Cells with cassettes 2 and 234Neo at RL1, as well as an artificial mixture of 100% negative cells and 100% positive cells, were sorted into populations of cells >99% negative and >99% positive for β-globZ expression and were monitored by FACS-Gal. In the case of cassettes 2 and 234Neo, the unsorted populations remained unchanged, while both the negative and positive populations returned to mosaic expression patterns similar to those of their parental populations within a few days, suggesting that expression of the β-globZ gene oscillates between activation and inactivation. (b) Demonstration of oscillations by subcloning. Subclones of cells with cassettes 0, 2, 3, and 234Neo at RL1 were monitored by FACS-Gal for up to 40 days. Black bars represent percentages of cells expressing β-globZ before subcloning; white bars represent percentages of cells expressing β-globZ 17, 24, or 39 days after subcloning for each of eight subclones (A to H). Almost all of the subclones displayed mosaic expression patterns similar to those of the parental populations, demonstrating the existence of oscillations. (c) Oscillations at RL3. Cassette 3 was inserted by RMCE at RL3. Subclones were then generated from four independent clones, and expression was analyzed by FACS-Gal. As at RL1, the progeny of individual cells display mosaic expression patterns demonstrating that the cells oscillate between activation and inactivation at this locus too. P, parental clones; a to h, eight independent subclones.

