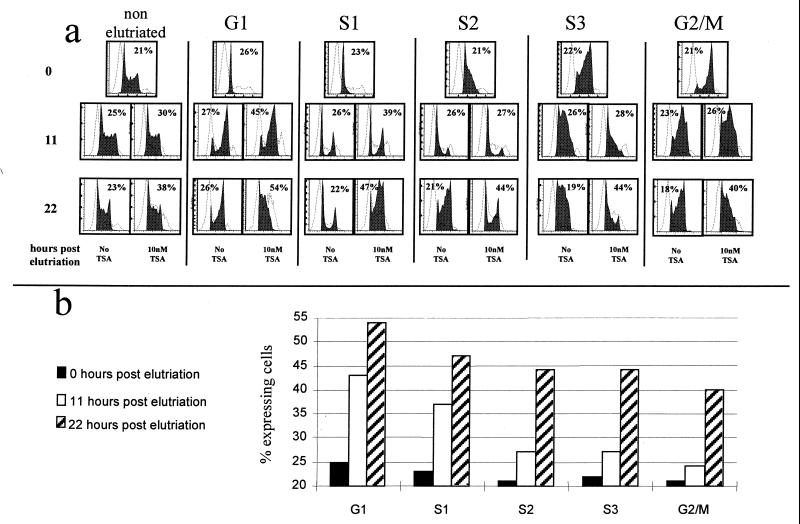
FIG. 6.
TSA acts only in G1 or early S. (a) Cells with HS2 at RL1 were elutriated into five cell cycle fractions (first row), and these five synchronized fractions were incubated for 11 (second row) and 22 (third row) h with or without TSA. Each fraction was monitored by FACS for its position in the cell cycle (black histogram; x axis = DNA content and y axis = cell number) and by FACS-Gal to determine the proportion of expressing cells (dotted histograms; x axis = level of β-globZ expression and y axis = cell number). The percentage of expressing cells determined by FACS-Gal is shown in the upper corner of each diagram. (b) The percentage of expressing cells is plotted for each cell fraction at each time point. The cells in G1 and S1 respond earlier than the other cells to TSA.

