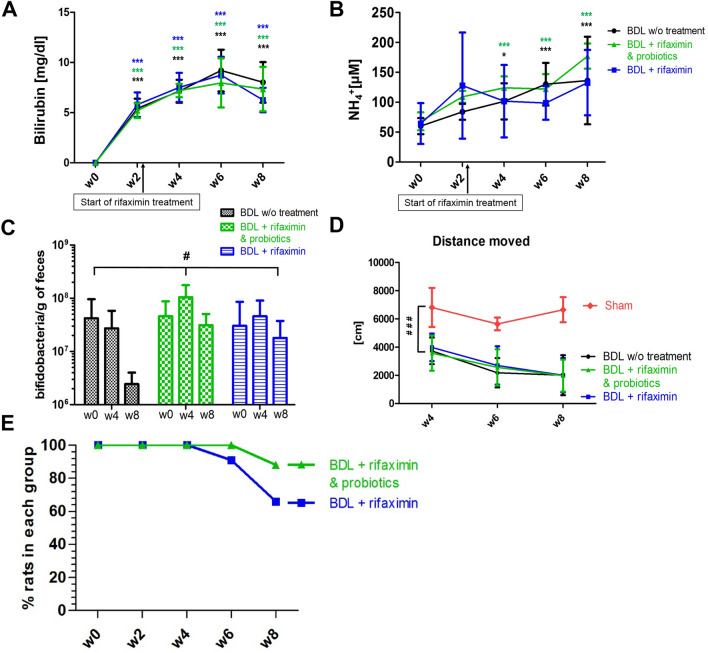
Figure 1.
Longitudinal changes in plasma total bilirubin (A) and NH4+ (B) in the three groups. In (A) and (B), statistical significance intra-group (labelled with ‘*’) is shown. (C) Bifidobacteria concentration in feces in the three BDL groups. (D) Distance traveled by the three groups of BDL and sham-operated rats. In (C) and (D), the overall statistical significance between-groups (‘treatment’ factor, labelled with ‘#’) is shown. (E) Percentage of BDL rats at each week in the ‘rifaximin + probiotics’ group and in the ‘rifaximin’ group. All results are presented as mean ± SD. One-way ANOVA was used to assess the significance intra-group (A, B) and two-way ANOVA to assess significance between-groups (‘treatment’ factor; C, D). Statistical significance: *p < 0.05; **p < 0.01; ***p < 0.001.

