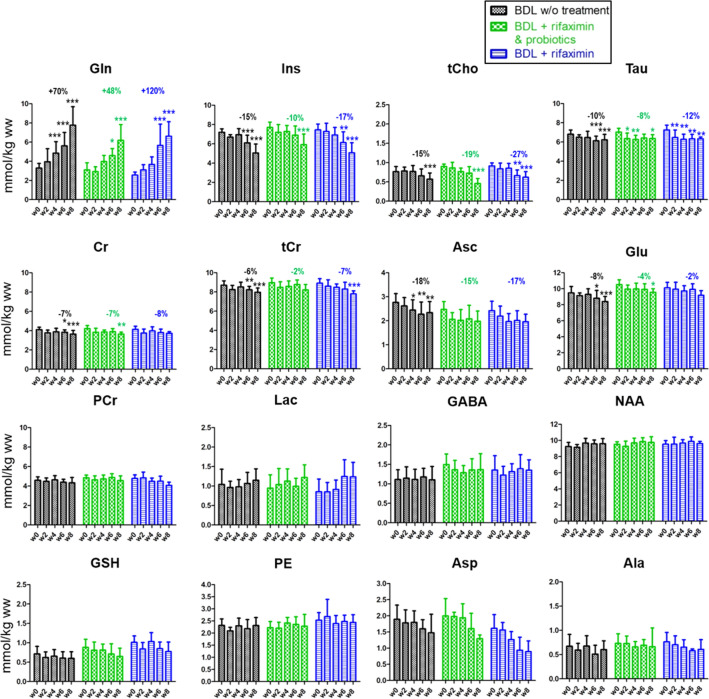
Figure 4.
Longitudinal 1H MRS data of brain metabolites in the hippocampus region of the ‘rifaximin’ treated group, the ‘rifaximin + probiotics’ treated group and the group without treatment. For better readability, relative changes indicated in the graph are shown only at week 6 relative to week 0 and are indicated for metabolites whose concentrations significantly varied over time. Statistical significance: One-way ANOVA (*p < 0.05; **p < 0.01; ***p < 0.001).

