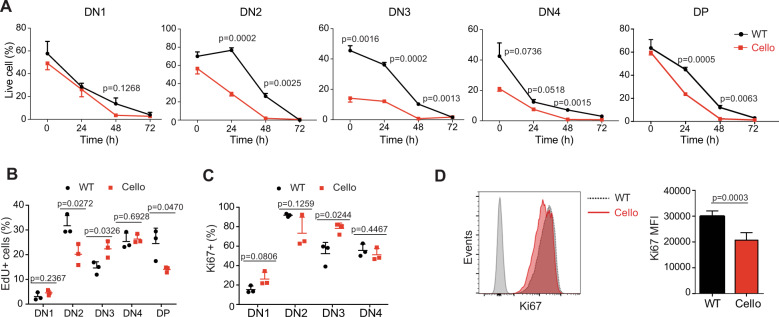
Fig. 5.
Cellophane DP cells show reduced survival and proliferation. a Percentages of annexin-V-negative cells (live cells) among wild-type and Cellophane thymocytes cultured for 0–72 h. Each graph shows a different subset, as indicated. b EdU incorporation in wild-type and Cellophane thymocytes after a 12-h in vivo pulse of 0.2 mg EdU. c Frequencies of Ki67+ cells in DN1-4 cell subsets from WT and Cellophane mice. d Ki67 nuclear staining in DP thymocytes from WT and Cellophane mice. Bar graphs (right panel) show the mean ± SD fluorescence intensity (MFI). Each dot represents an individual mouse. Data are pooled from three independent experiments with three mice in each group (a–d). Statistical analysis was performed using an unpaired Student’s t test

