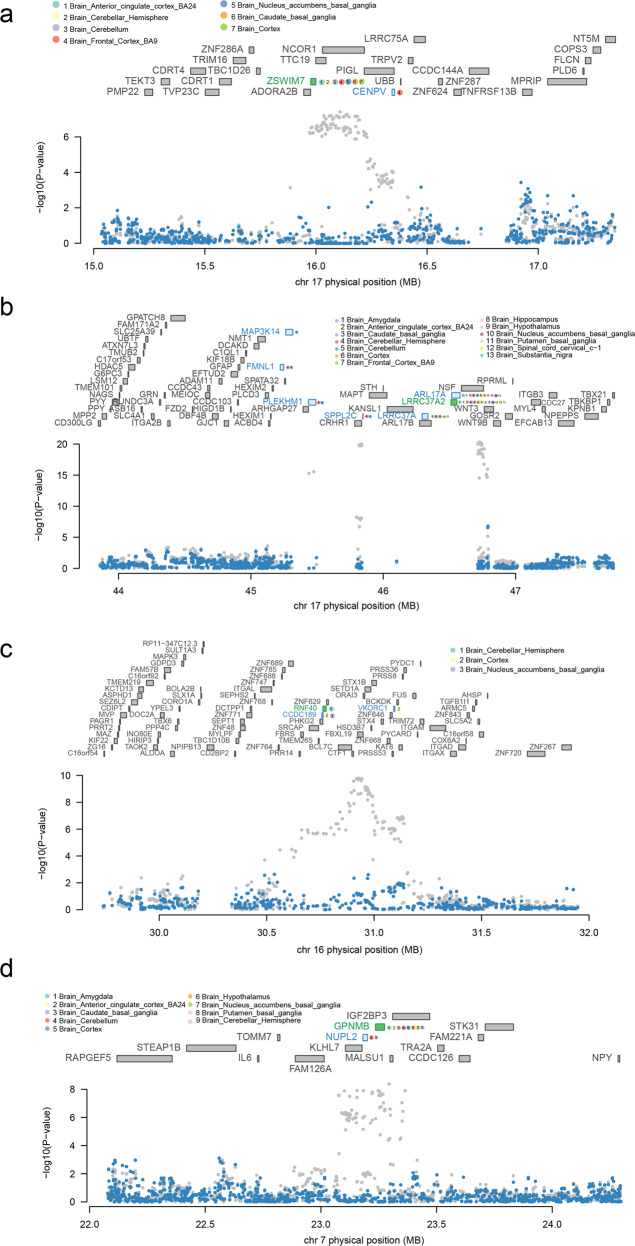
Fig. 3. Regional association of TWAS hits.
a Chromosome 17 regional association plot (part 1). b Chromosome 17 regional association plot (part 2). c Chromosome 16 regional association plot. d Chromosome 7 regional association plot. The marginally associated TWAS genes are shown in blue, and the conditionally significant genes are shown in green. The bottom panel shows a regional Manhattan plot of the GWAS data before (gray) and after (blue) conditioning on the green genes’ predicted expression.

