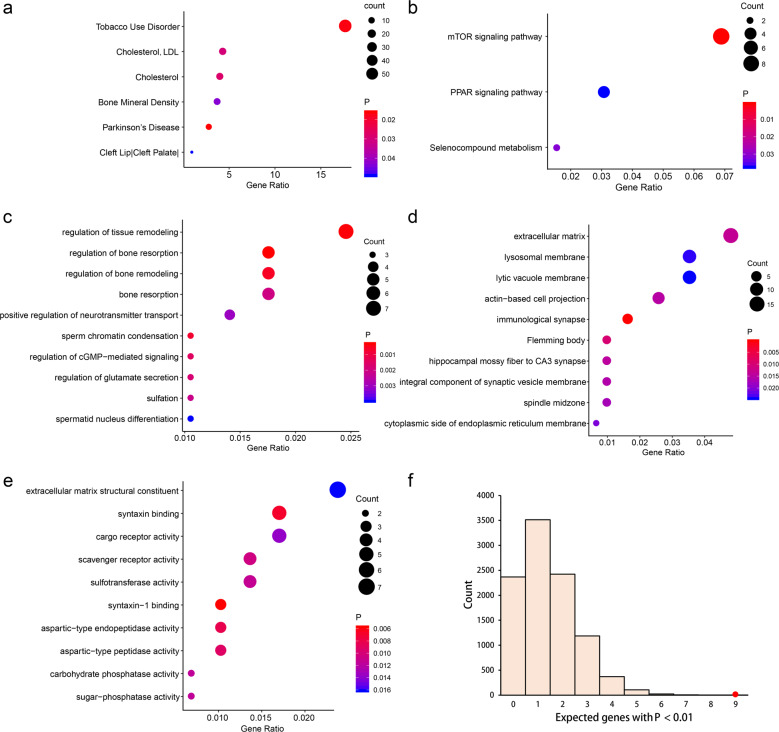
Fig. 4. Pathway enrichment results of TWAS-identified genes.
a GAD disease enrichment analyses of TWAS genes. b KEGG pathway enrichment analyses of TWAS genes. c–e Top ten GO terms enriched in TWAS genes, including biological processes (c), cellular component (d), and molecular function (e). f GWAS Catalog enrichment analyses of TWAS genes. The histogram shows the expected number of genes with P < 0.01 based on 10,000 random permutations. The large red point shows the observed number of previously known PD genes that fall below this threshold.

