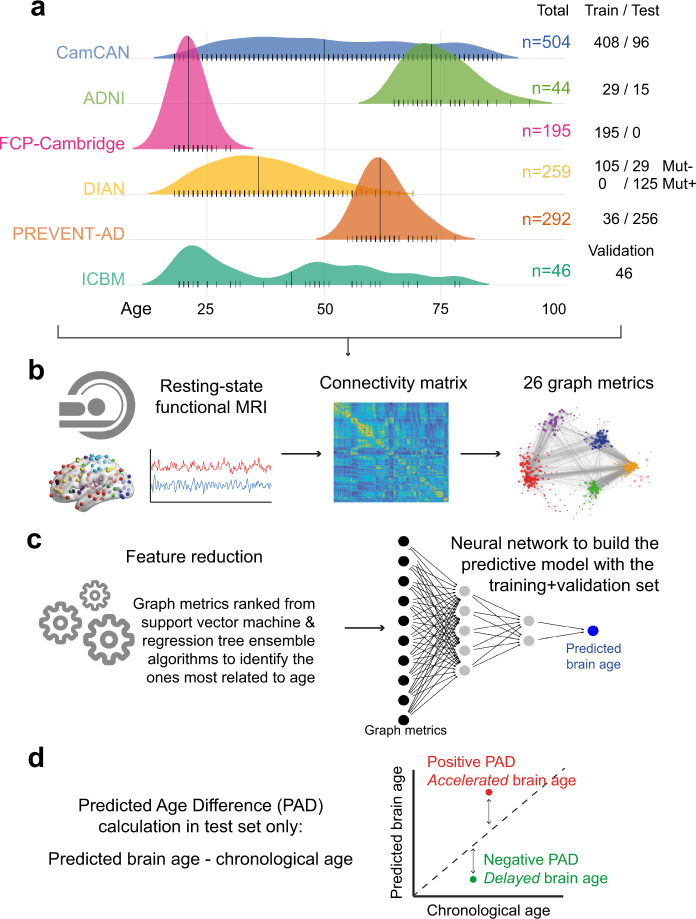
Fig. 1. Methodology overview.
a Multiple cohorts covering the lifespan were included in the study. They were separated into a training and validation set, both used to develop the predictive brain age model, and a test set in which our model was applied. b All participants underwent resting state functional magnetic resonance imaging that was processed with a uniform pipeline. Functional connectivity matrices were generated from the Power atlas82, from which graph metrics were calculated. Graph metrics were the input in our brain age model, and thus all possible metrics were of interest. c The first step toward building the model was to rank the different graph metrics from the most to least related to aging in our training set, to determine an order of importance to our model inputs using both support vector machine and regression tree ensemble algorithms. Neural networks were then tested to identify the best brain age model. Different architectures were tested, and the model applied in the training set that best generalized to the validation set was chosen as the final model (see Fig. 2). d The model was applied to the left-out test set and our measure of interest was the predicted age difference (PAD). Mut−: mutation non-carriers, Mut+: mutation carriers, MRI: magnetic resonance imaging, PAD: predicted age difference.

