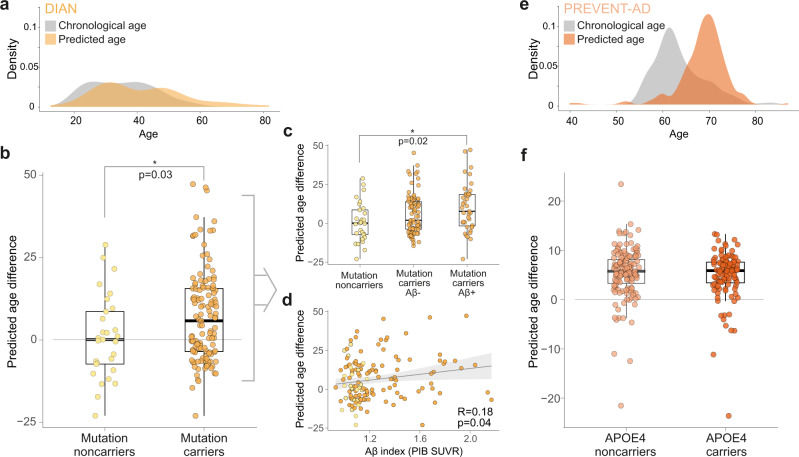
Fig. 3. Predicted age difference in DIAN and PREVENT-AD.
Density plot of chronological age vs predicted age in the test set participants in DIAN (n = 154) (a). Brain age is overestimated in autosomal dominant mutation carriers (n = 125) compared to non-carriers (n = 29) (b). The overestimation in mutation carriers is in part due to Aβ, with a difference between mutation noncarriers (n = 29) and Aβ+ mutation carriers (n = 39) only (Aβ− mutation carriers [n = 75] did not differ from the other groups) (c), and an association between Aβ load and predicted age difference across the whole cohort (n = 154) (d). Light (yellow) colors represent DIAN mutation non-carriers and darker (orange) colors represent DIAN mutation carriers. Density plot of chronological age vs predicted age in the test set participants in PREVENT-AD (n = 256) (e). In individuals at risk of sporadic Alzheimer’s disease, brain age is overestimated irrespectively of APOE ε4 genotype (f). Light (salmon) colors represent PREVENT-AD APOE ε4 non-carriers (n = 147) and darker (dark orange) colors represent PREVENT-AD APOE ε4 carriers (n = 108). For b, c and f the interquartile range (25th Percentile, Median and 75th Percentile), the whiskers (lines indicating variability outside the upper and lower quartiles minimum value) and the individual dots are presented. For d, shaded (gray) area represents confidence intervals (95%). Statistical values were obtained from general linear models (b, c, f) or partial Pearson’s correlations (d), controlling for chronological age, without further adjustment (two-sided tests). Aβ: beta-amyloid, Aβ−: amyloid-negative, Aβ+: amyloid-positive; APOE4: apolipoprotein E4, PIB: Pittsburgh compound B, SUVR: standardized uptake value ratio. Source data are provided as a Source data file.

