Figure 2.
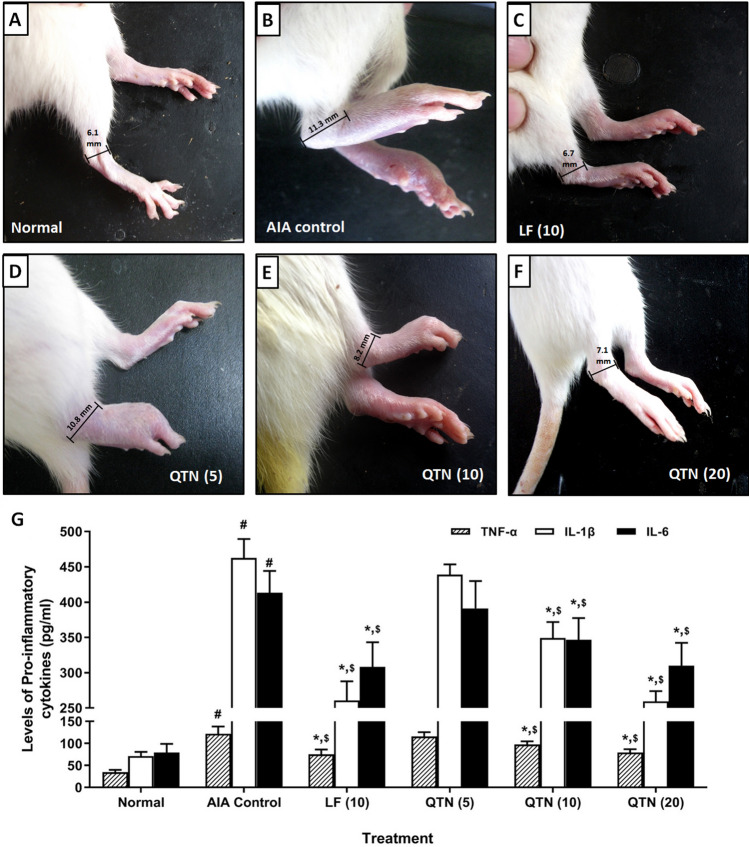
Effects of QTN on severity of ankle inflammation in rats (A-F). Representative images of paw from (A) normal rats, (B) AIA control rats with higher degree of inflammation, (C) Leflunomide (10 mg/kg) treated rats with reduced ankle inflammation, (D) QTN (5 mg/kg) treated rats with severe inflammation, (E) QTN (10 mg/kg) and (F) QTN (20 mg/kg) treated rats with reduced ankle inflammation. Effects of QTN on FCA-induced alterations in pro-inflammatory cytokines levels in synovial tissues (G). Values in parentheses indicate a dose in mg/kg (n = 6). Data was analyzed by one-way ANOVA followed by Tukey’s multiple comparisons test. For comparison with AIA-control group: *p < 0.05, comparison with normal group: #p < 0.05 and comparison with one another: $p < 0.05. AIA adjuvant-induced arthritis, LF leflunomide, QTN 3,5,7,3′,4′-pentahydroxy flavone, TNF-α tumor necrosis factor-alpha, ILs interleukins.

