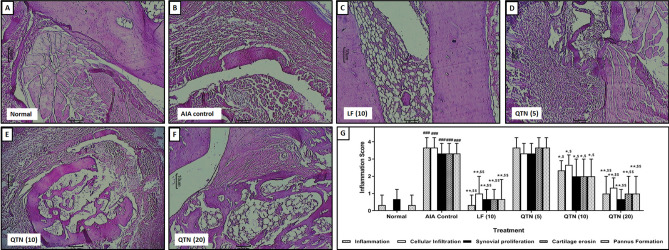
Figure 4.
Effects of QTN on the histopathology of tibiotarsal joints. Representative histological images from (A) normal, (B) AIA control, (C) leflunomide (10 mg/kg), (D) QTN (5 mg/kg), (E) QTN (10 mg/kg) and (D) QTN (20 mg/kg) treated rats. Images stained with H&E (× 100). The quantitative representation of histological score (G). Data were expressed as mean ± S.E.M. (n = 3), and one-way ANOVA followed by the Kruskal–Wallis test was applied for post hoc analysis. For comparison with AIA-control group: *p < 0.05, comparison with normal group: #p < 0.05 and comparison with one another: $p < 0.05.

