
Fig. 8. Stochastic recruitment of ASH drives gustatory plasticity in our computational model.
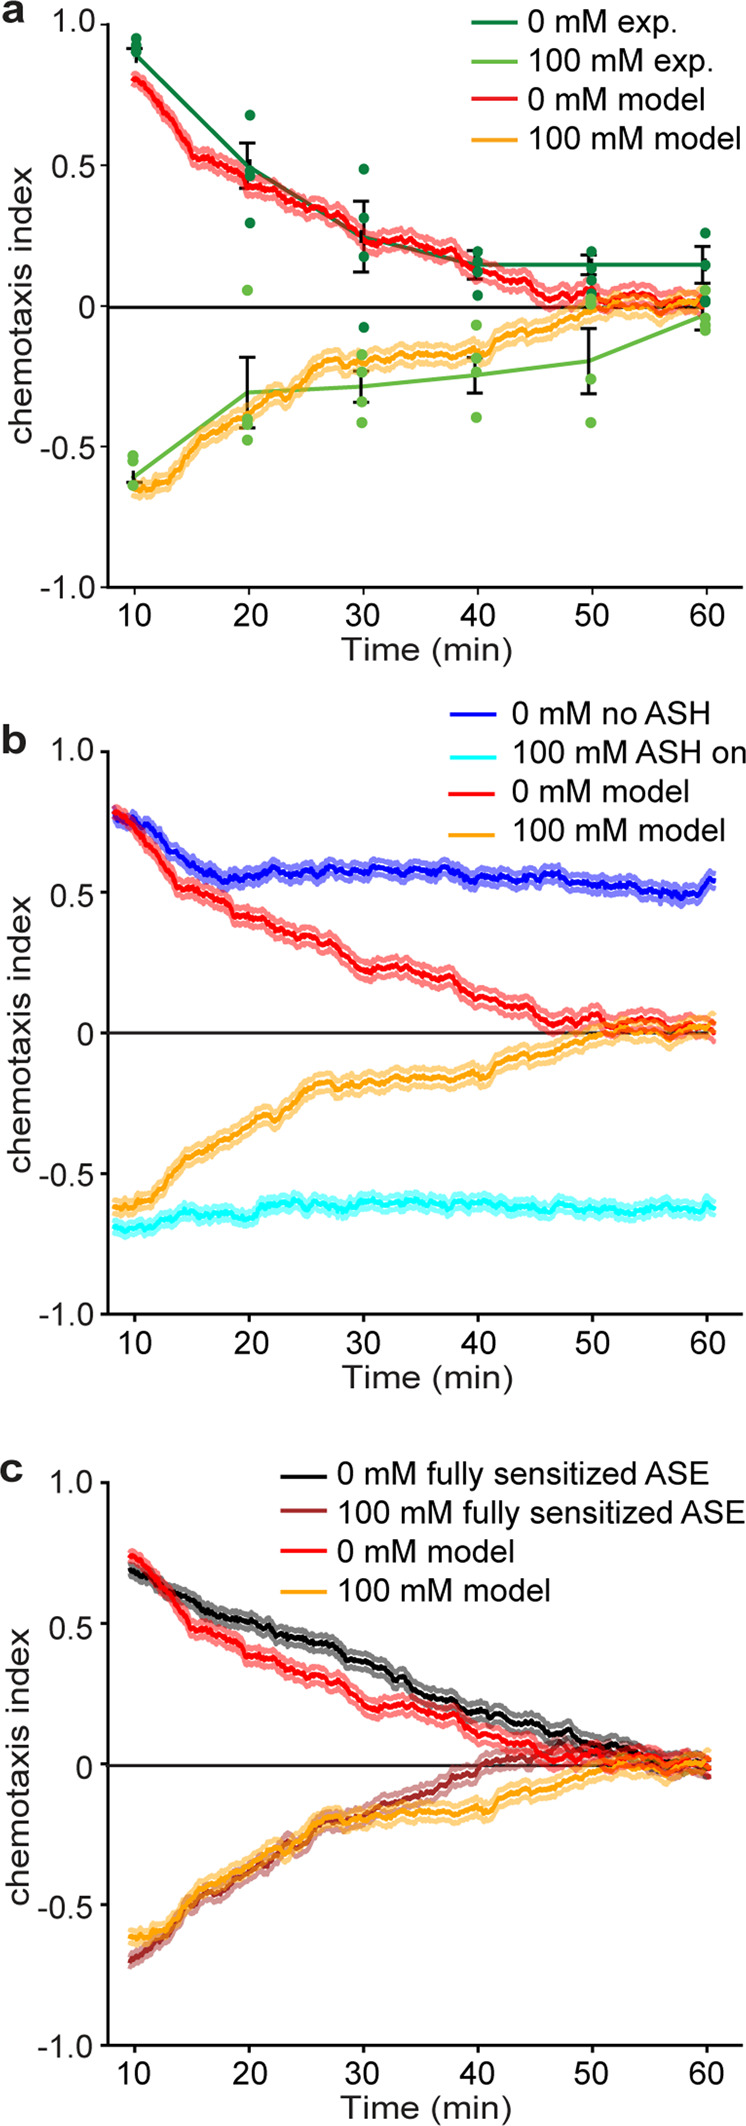
Chemotaxis index over time in experiments and simulations of the quadrant assay. a Average chemotaxis index (±SEM, individual data points have been indicated as dots) of naïve (0 mM) and pre-exposed (15 min, 100 mM NaCl) animals (n = 4 independent assays). The behavioral results (green) and the modeling results (red, orange) show a monotonic decay towards a chemotaxis index of 0, for both naïve and pre-exposed animals. b Virtual chemotaxis index for animals with unrecruited ASH (dark blue) and with recruited ASH (light blue). Without ASH state dynamics the chemotaxis index does not decay to 0. c Comparison of chemotaxis index for model with ASE (de)sensitization (red, orange) and with fully sensitized ASEL and ASER (black, brown). Source data underlying this figure are available in Supplementary Data 8.