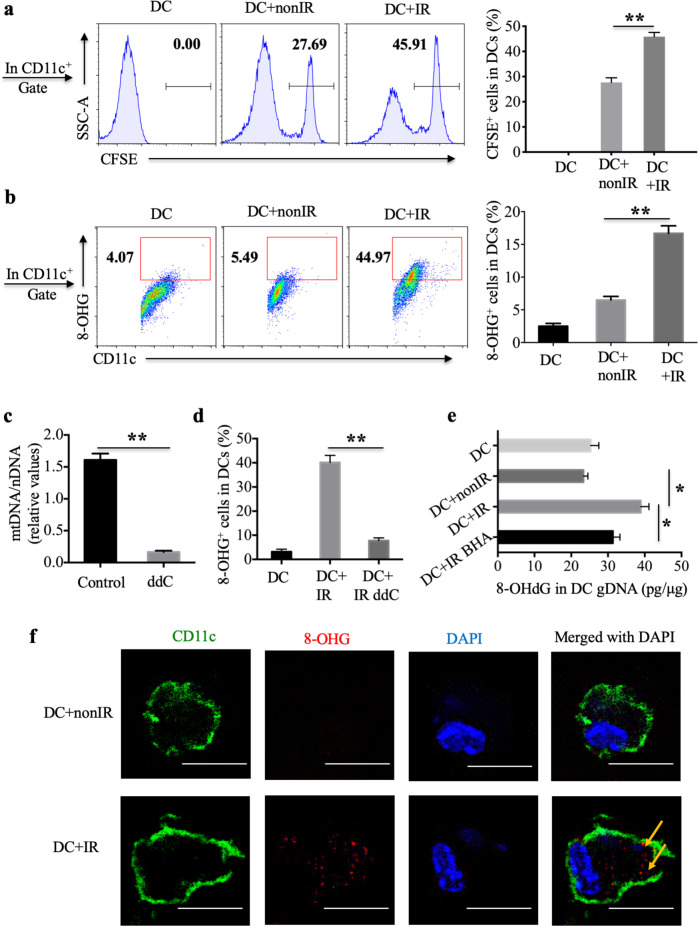
Fig. 4.
Oxidized mtDNA of irradiated cells gains access to the cytoplasm of DCs in vitro. a BMDCs were cultured with nonirradiated CFSE-stained EG7 cells or irradiated CFSE-stained apoEG7 cells for 3 h in vitro, subsequently labeled with an anti-CD11c antibody, and detected by flow cytometry. The percentages of CD11c+CFSE+ cells in CD11c+ DCs are shown. b BMDCs were cultured with untreated EG7 cells or apoEG7 cells for 3 h (stimulated DCs). The percentages of CD11c+8-OHG+ cells in CD11c+ DCs were determined by flow cytometry. c EG7 cells were treated with dideoxycytidine (ddC, 150 μM) for 6 days (ddC-plus EG7). The ratio of mitochondrial DNA to nuclear DNA was measured by real-time PCR, and untreated EG7 cells were used as a control. d BMDCs were cultured with ddC-plus apoEG7 cells for 3 h, subsequently labeled with anti-CD11c and anti-8-OHG antibodies and detected by flow cytometry. e Genomic DNA (μg) isolated from CD11c+ cells purified from stimulated DCs was evaluated with the 8-OHdG (pg) EIA Kit. BMDCs were also cultured with BHA-plus apoEG7 cells for 3 h. f Stimulated DCs were labeled to visualize CD11c (green), 8-OHG (red), and cell nuclei (DAPI, blue); scale bar, 10 μm. Data are representative of three experiments and presented as the mean ± SEM. *p < 0.05, **p < 0.01 (Student’s t-test)

