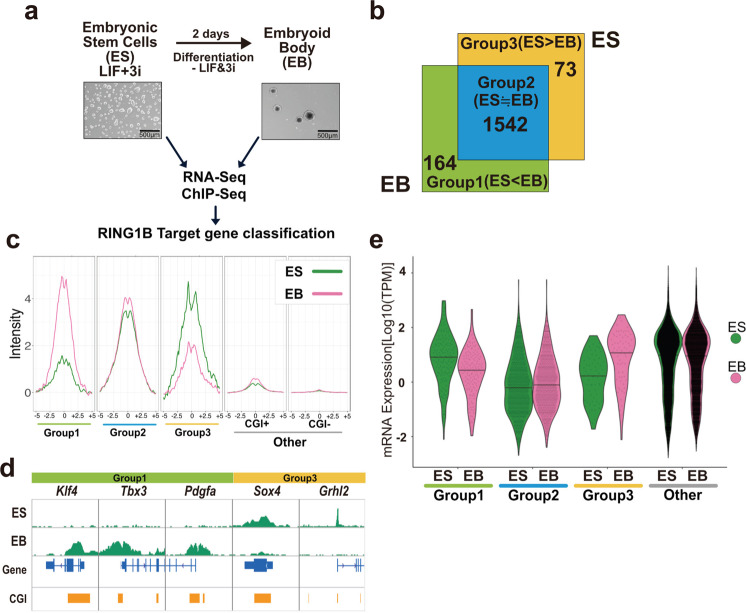
Fig. 1. Differentiation-associated accumulation of RING1B binding at Group 1 genes takes place in association with downregulation of gene expression.
a Overview of the experimental design to identify genes that are downregulated during ESC-to-EB differentiation and bound by RING1B. Representative colony morphologies for ESCs and EBs are also shown. Experiments were repeated independently at least 2 times with the same results. b Identification of genes at which RING1B binding changes during ESC-to-EB transition. The number of genes in each category is shown in the Venn diagram. Genes bound by RING1B are classified into “Group1” (Log2FC[EB/ES] > 1)., “Group2” (−1 ≤ Log2FC[EB/ES] ≤ 1) or “Group3” (Log2FC[EB/ES] < −1), and are indicated by green, blue and yellow, respectively. c Average binding of RING1B in each group in ESCs and EBs. Metaplot views of RING1B binding at TSS ± 5 kb at each gene group are shown. Genes not bound by RING1B in both ESCs and EBs are further divided into CGI + (associated with CGIs) or CGI- (not associated with CGIs). Data from ESCs or EBs are indicated by green or pink lines, respectively. d Binding of RING1B at selected Group1 genes (Klf4, Tbx3, Pdgfa), and Group3 genes (Sox4, Grhl2), in ESCs and EBs. Snapshots of RING1B distributions in the ESCs and EBs are shown. Gene structures and positions of CpG islands (CGI) are indicated at the bottom. e Changes in the expression of genes differentially bound by RING1B during ESC-to-EB differentiation. Violin plot shows of the expression of genes in each group, in ESCs and EBs.

