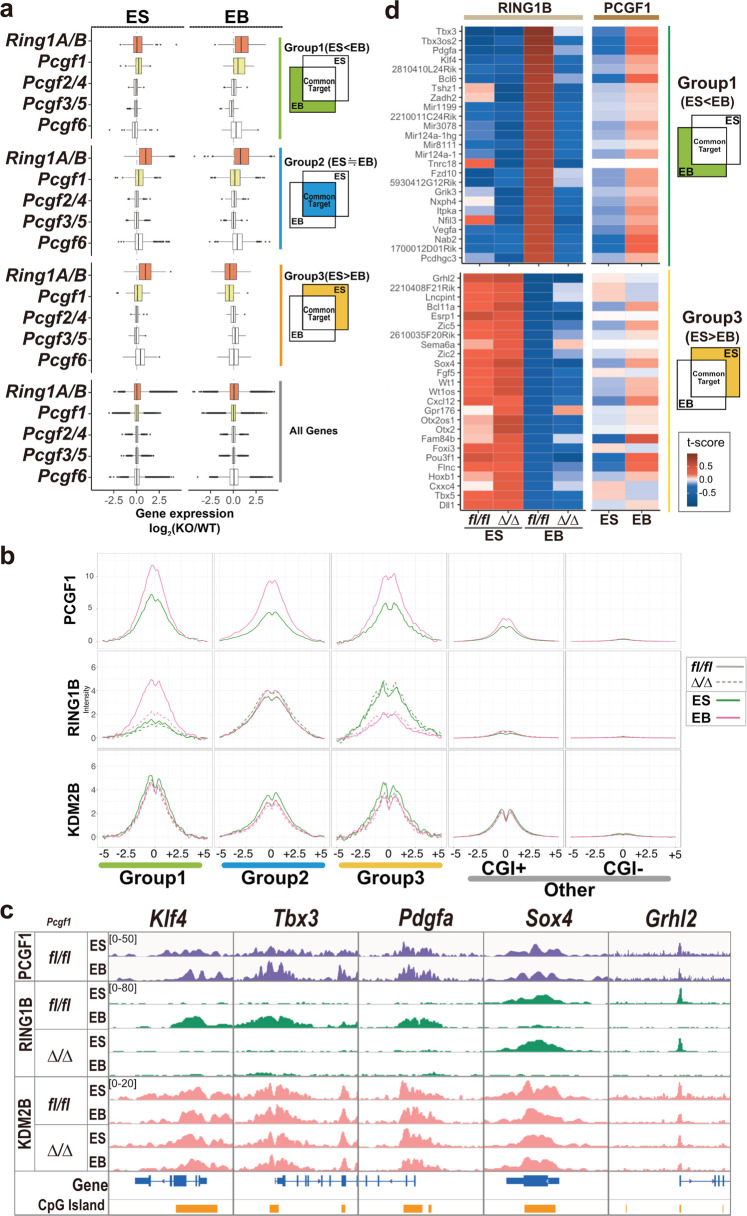
Fig. 2. PCGF1 is required for differentiation-associated downregulation of PRC1 target genes.
a Gene expression changes in each group (Group1: n = 164, Group2: n = 1542, Group3: n = 73) upon deletion of Ring1a/b, Pcgf1, Pcgf2/4, Pcgf3/5 or Pcgf6 in ESCs and EB. Box plot comparisons show fold changes (KO vs WT) in mRNA expression in ESCs and EBs. The interquartile range (IQR) is defined as follows: the first quartile (Q1) is greater than 25% of the data and less than the other 75%. The second quartile (Q2) sits in the middle, dividing the data in half. Q2 is also known as the median. The third quartile (Q3) is larger than 75% of the data and smaller than the remaining 25%. In a box and whiskers plot, the ends of the box and its centerline mark the locations of these three quartiles. Each whisker extends to the furthest data point in each wing that is within 1.5 times the IQR. The outlier value is > 1.5 times and < 3 times the IQR beyond either end of the box. b Average binding of PCGF1, RING1B, and KDM2B in each gene group in WT or Pcgf1-KO ESCs and EBs. Metaplot views of PCGF1, RING1B, and KDM2B binding at the TSS (5 kb upstream to 5 kb downstream) for each gene group in WT (fl/fl; solid lines) or Pcgf1-KO (∆/∆; dotted lines) ESCs and EBs. Data from ESCs and EBs are indicated by green and pink lines, respectively. c Binding of PCGF1, RING1B, and KDM2B at selected Group 1 genes (Klf4, Tbx3, Pdgfa) and Group 3 genes (Sox4, Grhl2) in WT or Pcgf1-KO ESCs and EBs. Genomic snapshots of PCGF1, RING1B, and KDM2B distributions in WT (fl/fl) or Pcgf1-KO (∆/∆) ESCs and EBs are also shown. Gene structures and positions of CpG islands are indicated at the bottom. d Binding of RING1B and PCGF1 at 25 Group 1 or 3 genes in WT or Pcgf1-KO ESCs and EBs. Heat map views show RING1B binding in WT (fl/fl) or Pcgf1-KO (∆/∆) ESCs and EBs.

