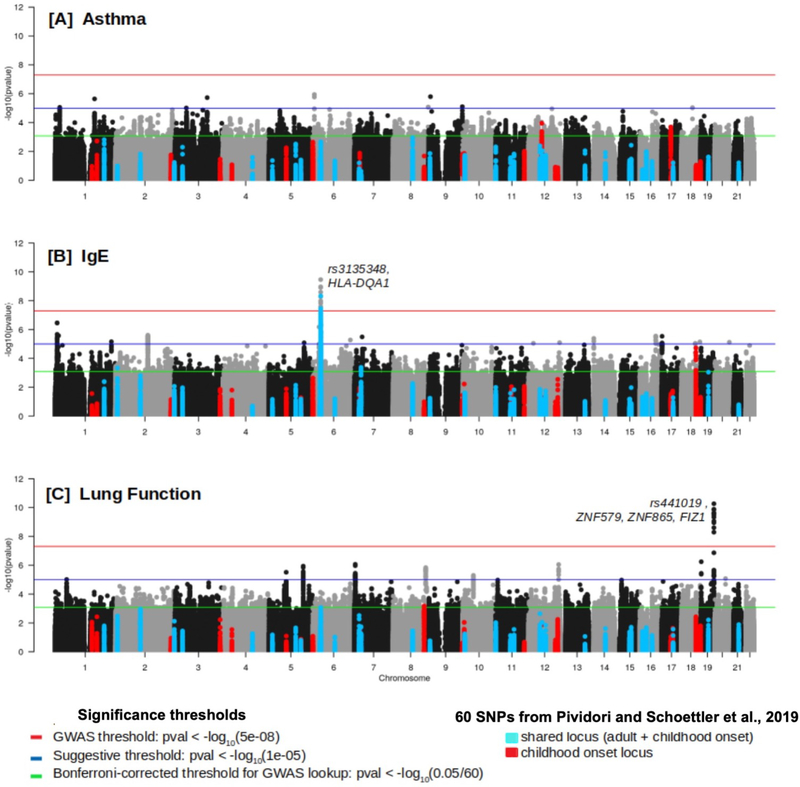
FIGURE 2:
Genomewide Manhattan Plots for (A) asthma, (B)IgE, and (C) lung function. Plots are annotated based on prior signals for childhood-onset asthma (unique or shared with adult-onset) from 60 different loci, defined as +/− 0.4 Mb from reference SNP in Table 2 of Pividori and Schoettler, et al, 2019, and three levels of statistical significance are shown.

