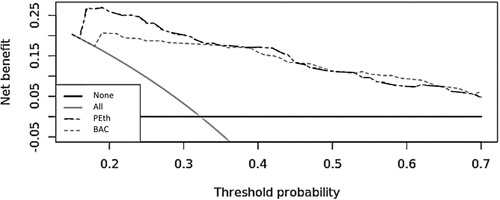
Figure 2.

Decision curve analysis between PEth and blood alcohol concentration for screening unhealthy alcohol use. Decision curve analysis was applied to examine the net benefit of the best derived biomarker against BAC. Net benefit is a decision analytic measure that puts benefits and harms on the same scale and is useful for clinical decisions. Net benefit is measured by sensitivity × prevalence - (1 – specificity) × (1 – prevalence) × w, where w is the odds at the threshold probability. Net benefit is plotted against threshold probabilities to yield a decision curve to weigh the relative harms of false-positive and false-negative screens. The diagram shows the scenarios for all screened (grey line) and none screened (dark black line) as well. BAC indicates blood alcohol concentration;PEth, phosphatidylethanol.
