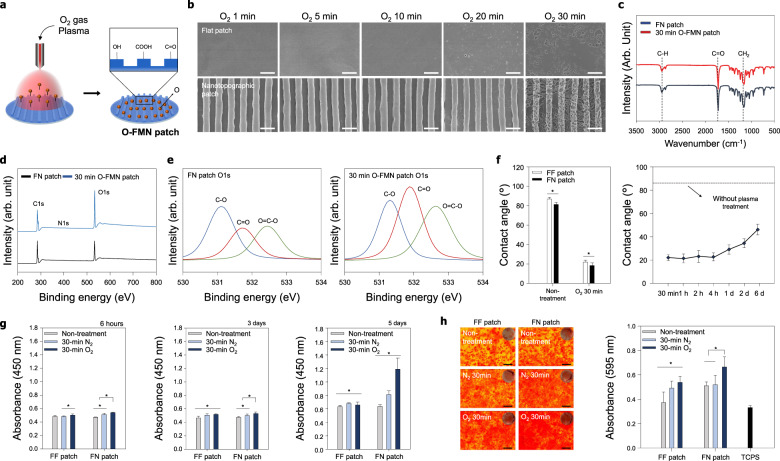
Fig. 3. Characterization of the O-FMN patch and effect of the O-FMN patch on cellular behaviors.
a Schematic of plasma surface modification using O2 plasma reaction gas on the surface of the FN patch. b SEM images of the O-FMN patch under various treatment times. The surface topography of the O-FMN patch showed the generation of nanopore structures without damage to the aligned nanotopography. Scale bars = 2 µm. c FT-IR analysis of the 30-min O-FMN. d XPS survey scans and e high-resolution O1s XPS spectra of FN patches and 30-min O-FMN patches. f Water contact angle measurements (n = 10 for each group) and wettability recovery (n = 5) on surfaces of the O-FMN patch. g Attachment and proliferation of cells on O-FMN patches (n = 6 for each group). After 5 days of cell culture, cell proliferation was higher on the 30-min O-FMN than on the 30-min N-FN. h Effect of O-FMN patches on the osteogenic mineralization of tenocytes. Alizarin Red staining revealed higher calcium expression levels on the 30-min O-FMN patches than on other samples and the tissue culture polystyrene substrate (TCPS). Quantification of osteogenic mineralization demonstrated the highest degree of osteogenesis by the cells on the 30-min O-FMN patches (n = 6 for each group). Scale bars = 200 µm. Error bars = mean ± standard deviation (*P < 0.05).

