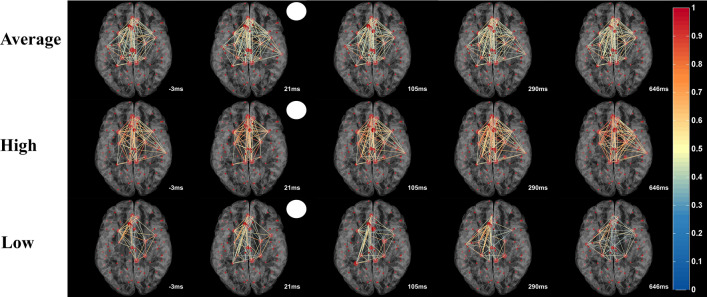
Figure 2.
Imaging “Brain Spacetime” in visual processing. Transient network formations during visual processing displayed in time-slices as a function of visual stimulus onset (white circle) in averaged normal rFCN. Hubs (big red dots) represent ROIs with high synchronization (hub scores 2–4, displayed by hub size). Links between the hubs were color-plotted as a function of their weight from 0 to 1. The top row shows the averaged hub locations and their inter-hub connections in normal brains. The lower rows show two representative subjects with different levels of network synchronization (high and low). The real-time video displayed in the Supplementary Video S1 illustrate the rapid rFCN dynamics of hubs in 8 ms resolution.

