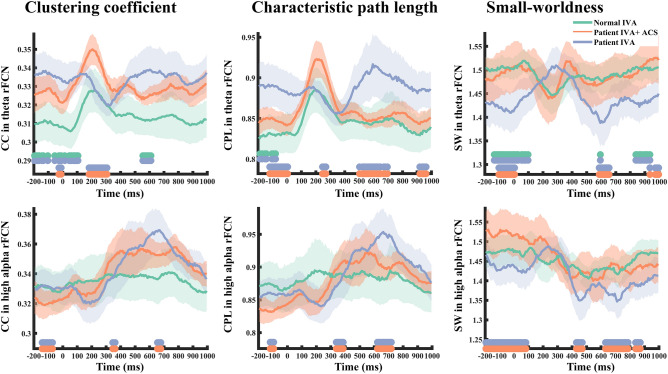
Figure 3.
Transient dynamics of global rFCN parameters. Multiple global rFCN matrices change across time during visual processing in control subjects (green line) and patients with optic nerve damage pre- (blue) and post-rtACS treatment (red). The horizontal green–blue bars on the x-axis indicate time windows with significant differences between controls and patients; orange–blue bars mark significant differences of pre- vs. post-treatment (p < 0.05).

