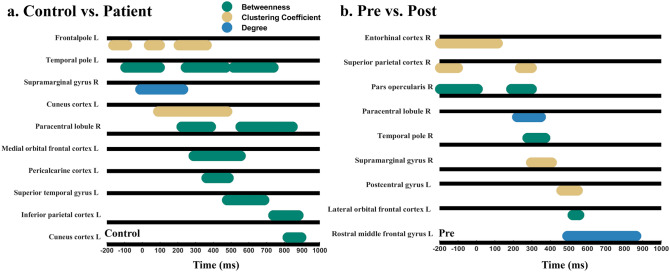
Figure 4.
Significant node centralities as a function of the network state. Significant node centrality dynamics for different brain regions as a function of time in reference to stimulus onset (0 ms) during the visual detection task. The black line is the respective reference value for the control group (a) or the pre-rtACS group (b). The colored horizontal bars display time windows of significant differences between groups (p < 0.05) (green: betweenness; yellow: clustering coefficient; brown: degree). Whereas activation increases are plotted above the respective reference line, activation decreases are plotted under the line. (a) The differences of local hub properties between controls and patients which were mainly observable for “betweenness centrality” which was higher in controls than in patients. But three non-hub regions in patients (hub score < 2) show significantly stronger betweenness than controls. Other non-hubs of patients showed significantly weaker local activation in multiple node centralities. (b) Effects of rtACS neuromodulation on rFCN dynamics. Brain regions showing significant differences of local FCN attributes after rtACS treatment (p < 0.05). While node centralities of some brain regions increased following rtACS neuromodulation, others decreased.

