Figure 5.
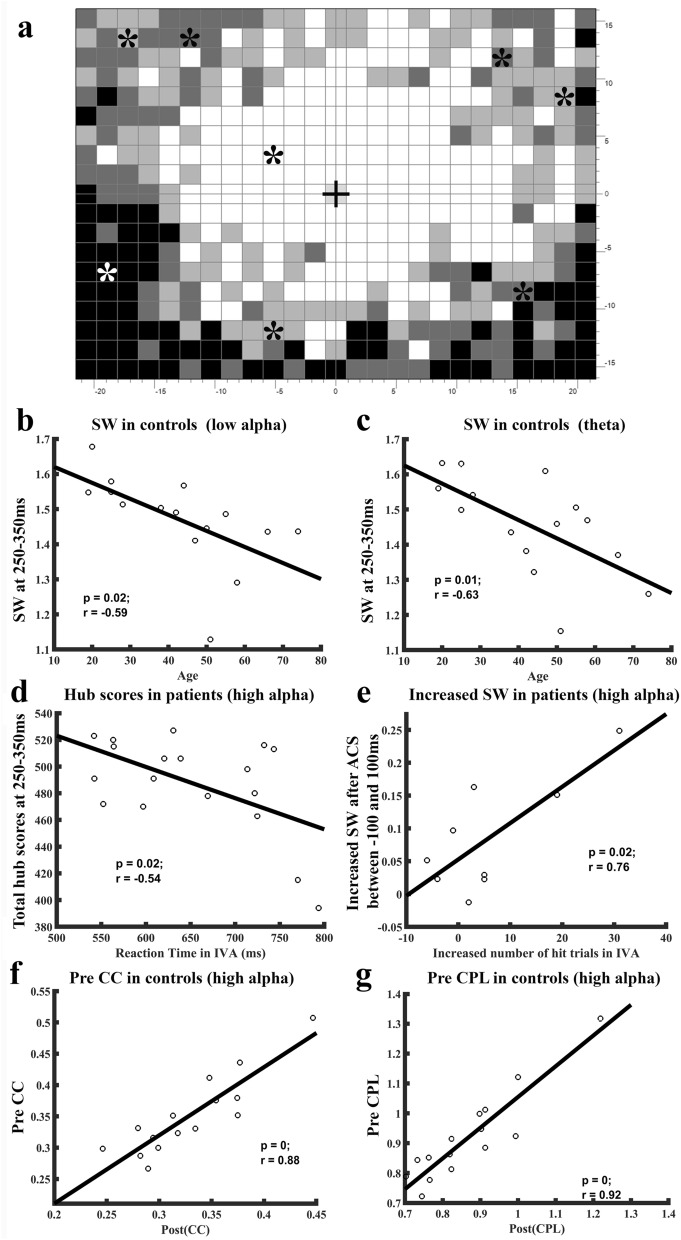
Visual detection performance in patients correlate with network metrics. (a) Typical perimetric visual field chart with central fixation (black cross) obtained from a patient showing individual placement of the stimulus positions (*stars). Grey levels represent percentage of responses detected in the respective region. One stimulus position was located in a white (intact) region of the visual field, six in grey areas of “partial” vision, and one in the blind region (black). (b–g) In normal subjects, small worldness (SW) was negatively correlated with the subjects’ age. Older subjects had weaker SW attributes during 250–350 ms following stimulus presentation in low alpha (b) and theta (c) rFCN. In optic nerve damage patients, higher total hub-score at 250–350 ms time window were correlated with the shorter reaction time (d). In patients after rtACS treatment, the increased SW during − 100 to 100 ms was positively correlated with the increased number of hit trials in the intact visual field sector (e). In addition, the maximum of clustering coefficient (f) and characteristic path length (g) in the post-task (250–650 ms) network were both positively correlated with the pre-task (100 ms before stimuli) network state. This means that ACS optimized the rFCN of patients, i.e. better vision was associated with a higher hub score and increased small worldness. And brain states at the time of visual stimulus onset had an influence on final task performance.

