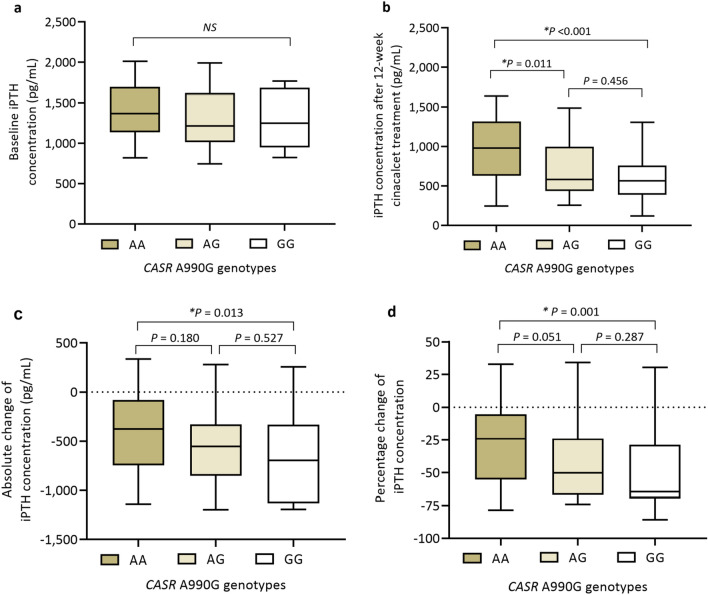
Figure 2.
Box plots of intact parathyroid hormone (iPTH) concentrations before and after 12 weeks of cinacalcet treatment of 135 participants (a) Baseline iPTH data (b) iPTH concentration after 12 weeks of cinacalcet treatment (c) Absolute change of iPTH concentration from baseline to 12 weeks (d) Percentage change of iPTH concentration from baseline to 12 weeks. In each box, the top, the middle line, and the bottom represent the 75th percentile, the median, and the 25th percentile, respectively. The whiskers show the maximum and the minimum. The data were compared by Kruskal–Wallis test among three genotypes and by Mann–Whitney test between two genotypes. *p < 0.05 was considered statistically significant.

