Fig. 1.
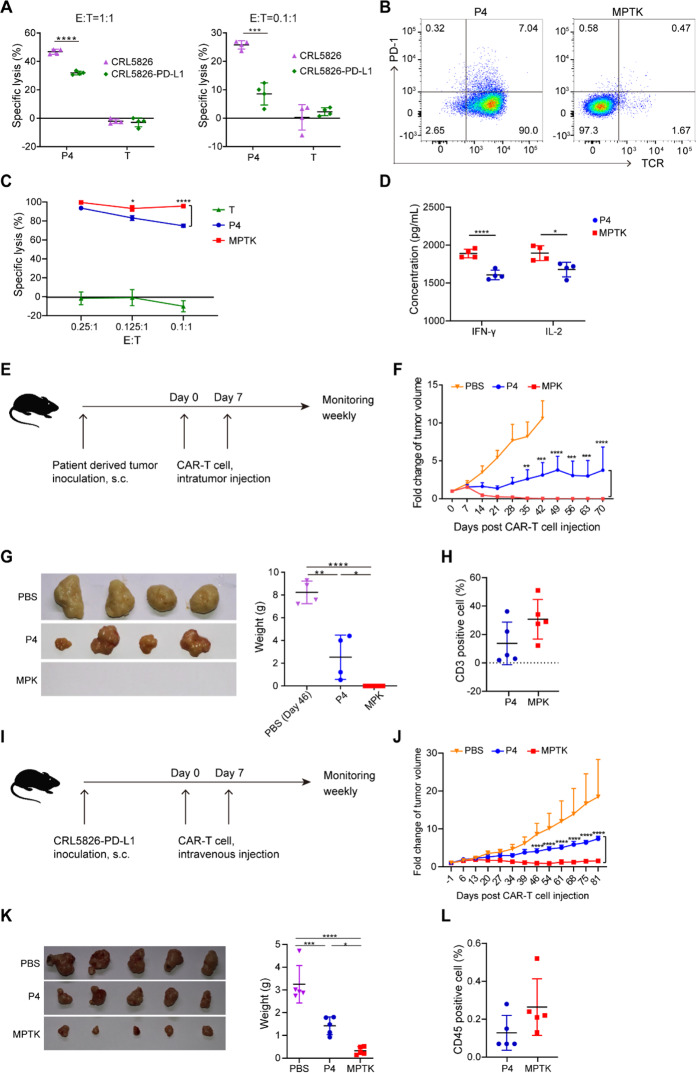
PDCD1/TRAC double knockout P4 CAR-T cells exhibited superior antitumor efficiency. A Bioluminescence-based cytotoxicity assay. The specific lysis of CRL5826 or CRL5826-PD-L1 tumor cells after being cocultured with P4 CAR-T cells at a 1:1 effector:target (E:T) ratio for 2 days or a 0.1:1 E:T ratio for 4 days is shown. T cells without lentivirus transduction are also shown. B Expression of PD-1 and TCR in P4 and MPTK-CAR-T cells by flow cytometry. C Cytotoxicity of P4 and MPTK-CAR-T cells cocultured with CRL5826-PD-L1 at a low E:T ratio for 3 days. D Production of the cytokines IFN-γ and IL-2 by MPTK and P4 CAR-T cells cocultured with CRL5826-PD-L1 cells at a 0.1:1 E/T ratio for 3 days. The essays in A and B were repeated independently using cells from three donors, and those in C and D were repeated using two donors. E–H Scheme of the in vivo assay to test the antitumor function of CAR-T cells. NPG mice were subcutaneously transplanted with patient-derived pancreatic tumor cells (PDX model). When tumors grew to ~200–300 mm3, MPK- or P4 CAR-T cells or PBS was injected intratumorally twice with 7 days between injections. The weights and tumor volumes of the mice were measured weekly (E). Tumor growth (F) and the sizes and weights of resected tumors (G) derived from PDX mice sacrificed at 46 days after CAR-T cell injection. H Peripheral blood analysis of the proportion of human CD3-positive cells at 42 days after CAR-T cell injection (n ≥ 4 animals per group). I–L Scheme of the in vivo assay to test the antitumor function of CAR-T cells. NPG mice were subcutaneously injected with CRL5826-PD-L1 cells (CDX model). When tumors grew to ~200–300 mm3, MPTK- or P4 CAR-T cells or PBS was injected intravenously twice with 7 days between injections. The weights and tumor volumes of the mice were measured weekly. I Tumor growth (J) and the sizes and weights of resected tumors (K) derived from CRL5826-PD-L1 tumor-bearing NPG mice sacrificed 81 days after CAR-T cell intravenous injection, and peripheral blood analysis of the proportion of human CD3-positive cells (L) at 69 days after CAR-T cell injection (n = 5 animals per group). Statistics were analyzed with unpaired Student’s t test (A, D, H, and L) and ANOVA with Tukey’s multiple-comparisons test (C, F, G, J, and K). Data are represented as the mean ± standard deviation (SD). *P < 0.05; **P < 0.01; ***P < 0.001; ****P < 0.0001

