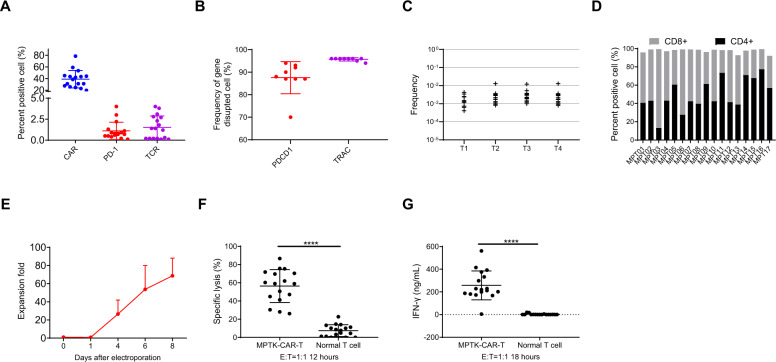
Fig. 2.
Characterization of clinical-grade MPTK-CAR-T cell products. A Flow cytometric analysis of CAR, PD-1, and TCR surface expression in MPTK-CAR-T cell products. Individual data points and the mean with SD are shown. B The frequencies of gene editing for PDCD1 and TRAC in 9 MPTK-CAR-T infusion products. Individual data points and the mean with SD are shown. C Translocation frequency in 15 MPTK-CAR-T cell products. T1 to T4 represent four different possible translocation events. D CD8/CD4 ratio of MPTK-CAR-T cell products. E In vitro expansion of MPTK-CAR-T cell products. The fold changes in the cell number of MPTK-CAR-T cells after electroporation are shown. F Cytotoxicity assay using MPTK-CAR-T cells and normal T cells as effectors and the CRL5826-PD-L1 cell line as a target. Individual data points and the mean with SD at an E:T ratio of 1:1 are shown. MPTK-CAR-T cells vs. normal T cells, ****P < 0.0001. G IFN-γ release assay using MPTK-CAR-T cells and normal T cells as effectors and the CRL5826-PD-L1 cell line as a target. Individual data points and the mean with SD at an E:T ratio of 1:1 are shown. MPTK-CAR-T cells vs. normal T cells, ****P < 0.0001. Statistics were analyzed with an unpaired t test (F and G)

