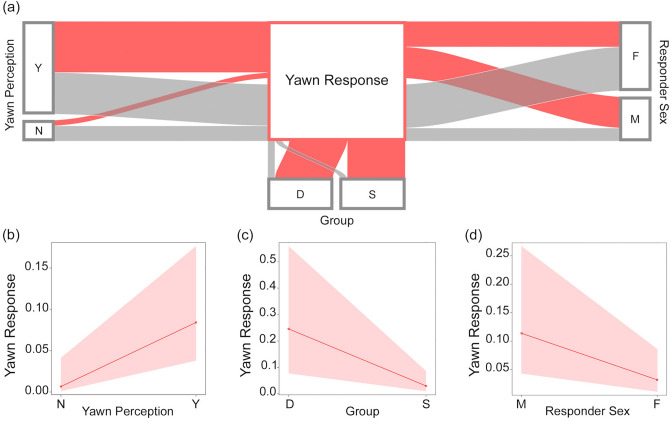
Figure 2.
GLMM results. (a) Alluvial plot showing the frequency of presence (Red streams) and absence of (Grey streams) Yawn Response for each level of the factors “Perception” (Y = perception, N = no perception), “Group” (D = different groups, S = same group) and “Responder Sex” (F = female, M = male). (b) Effect of variables “Perception” (Y = perception, N = no perception), (c) “Group-membership” (D = different groups, S = same group) and (d) “Sex responder” (F = female, M = male) on the Yawn Response. Band represents the confidence interval. (Graphs created via R freeware, version 3.5.3; https://www.R-project.org).

