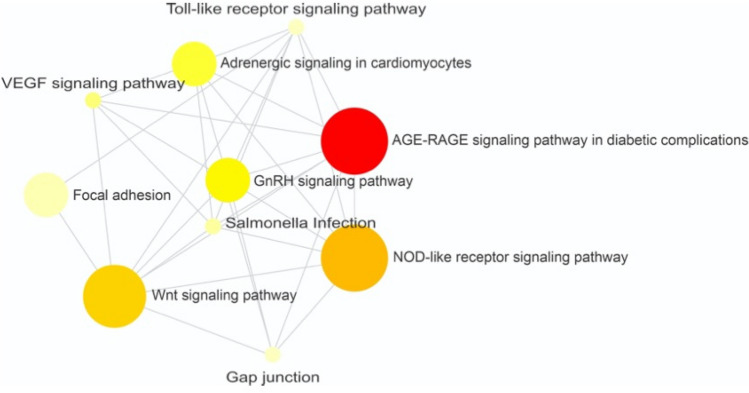
Figure 2.
Gene network of differentially expressed genes-enrichment analysis using KEGG with chicken information. Circles represent metabolic pathways and connecting lines represent interactions between them, according to the active NetworkAnalyst prediction method. Nodes are colored according to their over-representation analysis (ORA) p-value. Darker colors are the smallest p-values. The node size is related to the number of genes enriched in each pathway.

