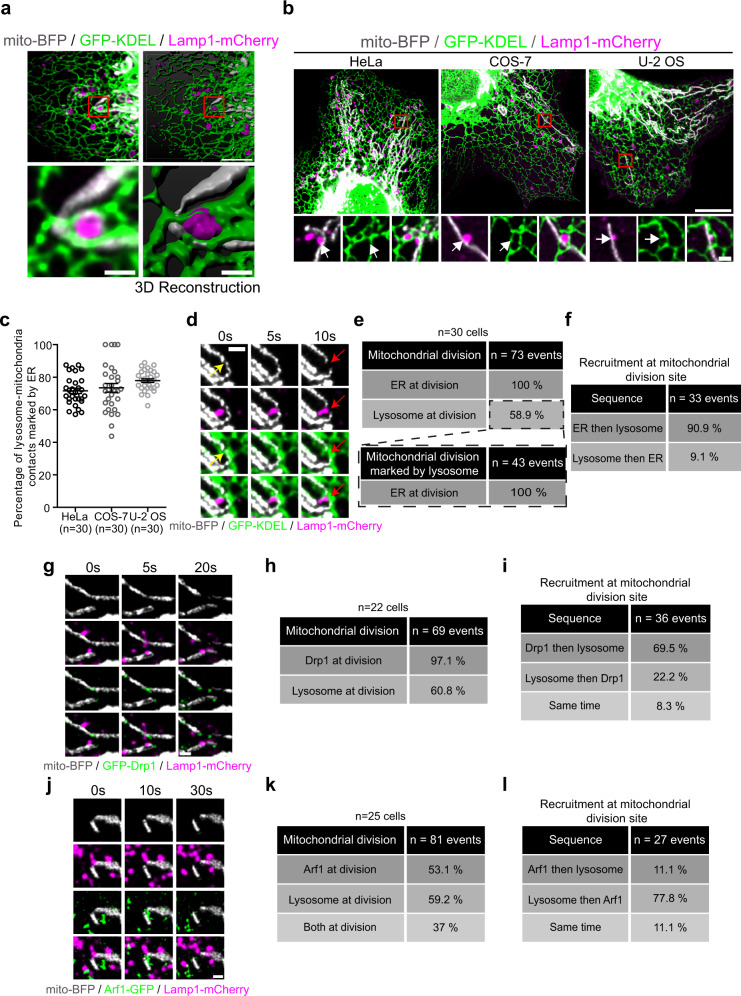
Fig. 1. Lysosomes, mitochondria, and the ER are involved in a three-way contact that participates in a late step of mitochondrial division.
a Representative image and three-dimensional reconstruction of an ER-lysosome-mitochondrion three-way contact in a COS-7 cell. Scale bars: 5 and 1 µm (inset). b HeLa, COS-7, and U-2 OS expressing mito-BFP, GFP-KDEL, and Lamp1-mCherry. Insets are the magnification of the area indicated by the red box showing a lysosome-mitochondria contacts marked by the ER. White arrow indicates a lysosome-mitochondria contact. Scale bars: 10 µm and 1 µm (inset). c Quantification of the percentage of lysosome-mitochondria contacts that are marked by the ER in HeLa, COS-7, and U-2 OS cells. The graph shows the mean ± SEM. Cells from three independent experiments. d Live-cell imaging of HeLa cells expressing mito-BFP, GFP-KDEL, and Lamp1-mCherry over 10 s. Yellow arrows indicate an ER-mediated mitochondrial constriction site and red arrows indicate a mitochondrial fission event. Scale bar: 1 µm. e Percentage of mitochondrial division events (cells from three independent experiments) marked by the ER or lysosomes and the percentage of lysosomes marked division events that were also marked by the ER in HeLa cells. f Sequence of recruitment of the ER and lysosomes at mitochondrial division site for events that were positive for both the ER and lysosome in e. g–i Live-cell imaging of HeLa cells expressing GFP-Drp1, mito-BFP, and Lamp1-mCherry (g). Scale bar: 1 µm. h Percentage of mitochondrial division events marked by Drp1 and by lysosomes (cells from two independent experiments). i Sequence of recruitment of Drp1 and lysosomes at mitochondrial division site for events that were positive for both Drp1 and lysosome. j–l Live-cell imaging of HeLa cells expressing mito-BFP, GFP-Arf1, and Lamp1-mCherry (j). Scale bar: 1 µm. k Percentage of mitochondrial division events marked by Arf1 and by lysosomes (cells from two independent experiments). l Sequence of recruitment of Arf1 and lysosomes at mitochondrial division site for events that were positive for both Arf1 and lysosome. f, i, l Division sites that were already positive for both markers at the beginning of the acquisition were excluded from the analysis.

