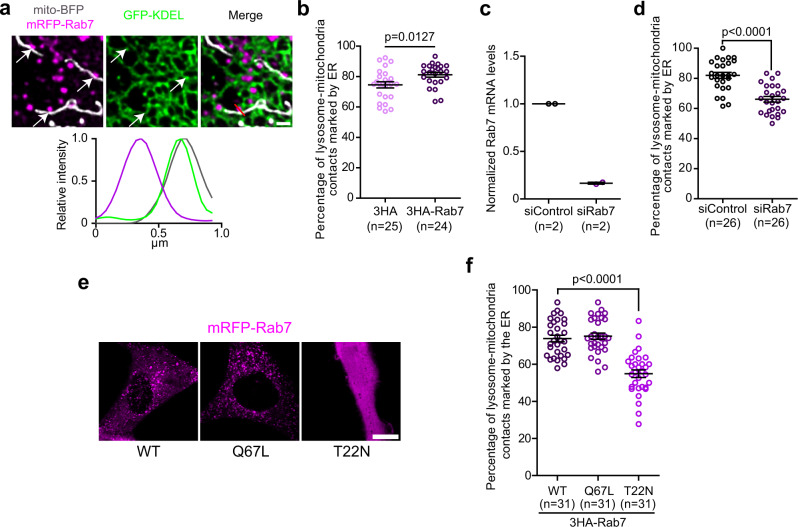
Fig. 2. Rab7 regulates a subset of ER-lysosome-mitochondria three-way contacts.
a Representative image of Rab7 positive lysosomes-mitochondria contacts that are marked by the ER in HeLa cells expressing mRFP-Rab7, GFP-KDEL, and mito-BFP. White arrows indicate the lysosome-mitochondria contacts. Line-scan analysis of relative fluorescence intensities (left to right) from the red line shown in merge. Scale bar: 1 µm. b Quantification of the percentage of lysosome-mitochondria contacts marked by the ER in HeLa cells expressing either a wild-type Rab7 or a control vector, with mito-BFP, GFP-KDEL, and Lamp1-mCherry. The graphs show the mean ± SEM, cells from three independent experiments. Two-sided unpaired t-test. c Normalized Rab7 mRNA levels in cells transfected by a siRNA targeting specifically Rab7 or a control siRNA measured by RT-qPCR. The graphs show the mean ± SEM, cells from two independent experiments. d Quantification of the percentage of lysosome-mitochondria contacts marked by the ER when Rab7 expression level was downregulated by a siRNA targeting Rab7 compared to a control siRNA in cells expressing Lamp1-mCherry, mito-BFP, and GFP-KDEL. The graphs show the mean ± SEM, cells from three independent experiments. Two-sided unpaired t-test. e Representative images of HeLa cells expressing the wild-type (WT), constitutively active (Q67L), or dominant negative (T22N) mRFP-Rab7. Note that the dominant negative Rab7 (T22N) does not localize to lysosomes but is cytosolic. Scale bar: 10 µm. f Quantification of the percentage of lysosome-mitochondria contacts that are marked by the ER in HeLa cells expressing either the 3HA-Rab7 or its mutants with Lamp1-mCherry, mito-BFP, and GFP-KDEL. The graph shows the mean ± SEM, Cells from three independent experiments. One-way ANOVA with Dunnett’s Multiple Comparison Test.

