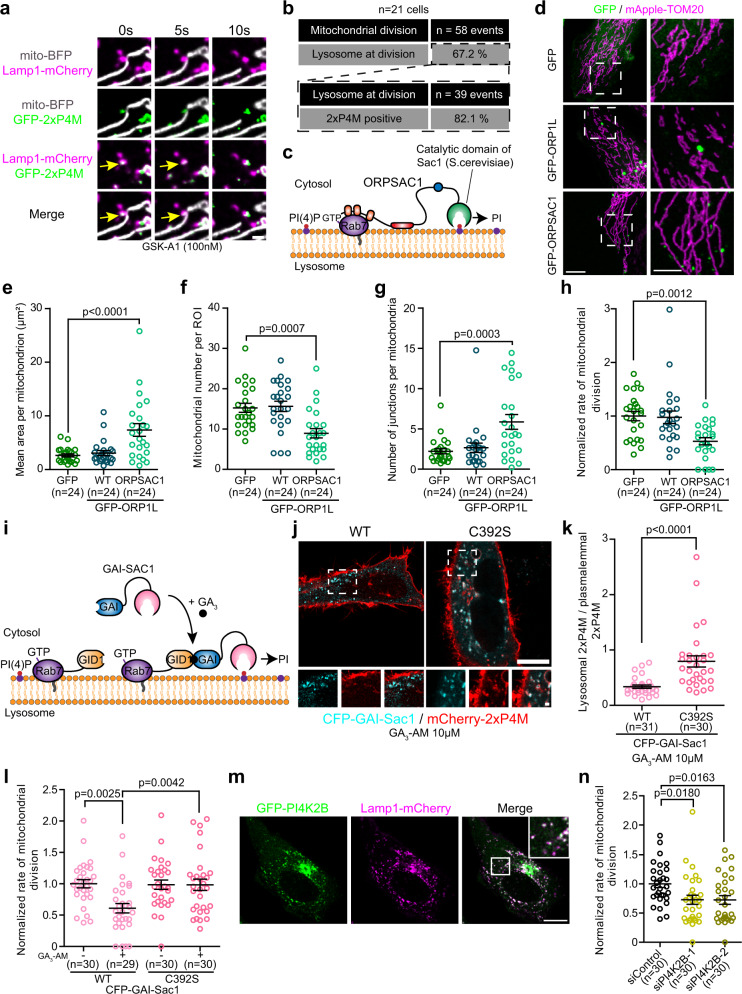
Fig. 5. Lysosomal PI(4)P contributes to mitochondrial division.
a Representative image of a mitochondrial division marked by a GFP-2xP4M positive lysosome (yellow arrow) in HeLa cells expressing the indicated markers. PI4KA inhibitor GSK-A1 treatment allowed to better visualize PI(4)P at lysosomes. Scale bar: 1 µm. b Percentage of mitochondrial division events marked by lysosomes (cells from two independent experiments) and of lysosomes marked by GFP-2xP4M at mitochondrial division events. c In ORPSAC1, the ORD domain of ORP1L was replaced by the catalytic domain of Sac1 allowing the dephosphorylation of lysosomal PI(4)P. d Representative maximum projection images of mitochondrial morphology in HeLa cells overexpressing the indicated constructs. Scale bars: 10 µm and 5 µm (inset). e–g Mitochondrial morphology was quantified for e mean area per mitochondrion, f mitochondrial number per region of interest (ROI), and g number of junctions per mitochondria. Cells from three independent experiments. One-way ANOVA with Dunnett’s Multiple Comparison Test. h Normalized rate of mitochondrial division in HeLa cells overexpressing the indicated constructs. Cells from three independent experiments. One-way ANOVA with Dunnett’s Multiple Comparison Test. i Cytosolic GAI-Sac1 can be recruited to GID1-Rab7 lysosomes upon GA3-AM treatment to specifically deplete lysosomal PI(4)P. j, k Representative images of HeLa cells expressing CFP-GAI-Sac1 or the catalytic dead C392S mutant, iRFP-GID1-Rab7, and mCherry-2xP4M after GA3-AM treatment (j). Scale bars: 10 µm and 1 µm (inset). k Quantification of the lysosomal levels, normalized by the plasmalemmal levels, of 2xP4M. Cells from three independent experiments. Two-sided unpaired t-test. l Normalized rate of mitochondrial division before or after GA3-AM treatment in HeLa cells overexpressing iRFP-GID1-Rab7 and the indicated constructs. Cells from three independent experiments. Two-way ANOVA, Sidak’s multiple comparisons test. m Representative image of a HeLa cell expressing GFP-PI4K2B and Lamp1-mCherry with zoomed insert of white box in merge panel. Scale bar: 10 µm. n Normalized rate of mitochondrial division in HeLa cells treated with the indicated siRNAs. Cells from three independent experiments. One-way ANOVA with Dunnett’s Multiple Comparison Test. e–h, k, l, n All graphs show the mean ± SEM.

