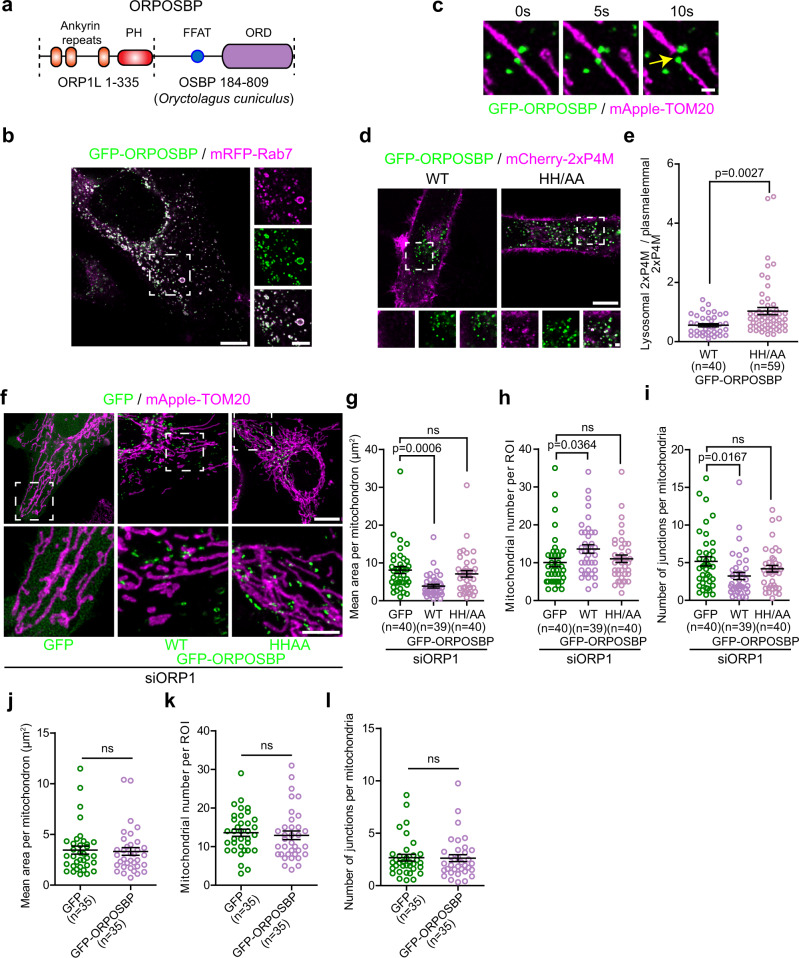
Fig. 6. Targeting the PI(4)P transfer protein OSBP to lysosomes rescues the mitochondrial morphology alterations caused by ORP1L depletion.
a ORPOSBP is a chimeric protein made of the amino acids 1 to 335 of ORP1L fused to amino acids 184 to 809 of OSBP from Oryctalogus cuniculus. Domains are not to scale. b Representative image of a Hela cell expressing GFP-ORPOSBP and mRFP-Rab7. Zoomed images of dashed box shown on right. Scale bars: 10 µm and 5 µm (inset). c Time-lapse images of HeLa cells expressing GFP-ORPOSBP and mApple-TOM20. The yellow arrow shows a mitochondrial fission event marked by GFP-ORPOSBP. Scale bar: 1 µm. d, e Representative images of HeLa cells expressing the wild-type GFP-ORPOSBP or the lipid binding deficient HH/AA mutant with the PI(4)P probe mCherry-2xP4M (d). Scale bars: 10 µm and 1 µm (inset). e Quantification of the lysosomal levels of 2xP4M normalized by the plasmalemmal levels of the probe. The graphs show the mean ± SEM, cells from three independent experiments. Two-sided unpaired t-test. f Representative maximum projection images of mitochondrial morphology in HeLa cells treated with siRNA downregulating ORP1L and overexpressing GFP, GFP-ORPOSBP or the HH/AA ORPOSBP mutant and mApple-TOM20. Note that ORPOSBP wild-type expression, but not of the HH/AA mutant rescue the mitochondrial elongation and hyperfusion of the mitochondrial network caused by ORP1L depletion. Scale bars: 10 µm and 5 µm (inset). g–i Mitochondrial morphology was quantified for g mean area per mitochondrion, h mitochondrial number per region of interest (ROI), and i number of junctions per mitochondria. Cells from three independent experiments. One-way ANOVA with Dunnett’s Multiple Comparison Test, ns non statistically significant: g p = 0.6437, h p = 0.7205, and i p = 0.3046. The graphs show the mean ± SEM. j–l Mitochondrial morphology of Hela cells expressing GFP or GFP-ORPOSBP was quantified for j mean area per mitochondrion, k mitochondrial number per region of interest (ROI), and l number of junctions per mitochondria. Cells from three independent experiments. Two-sided unpaired t-test, ns non statistically significant. j p = 0.8011, k p = 0.6381 and l p = 0.9266. The graphs show the mean ± SEM.

