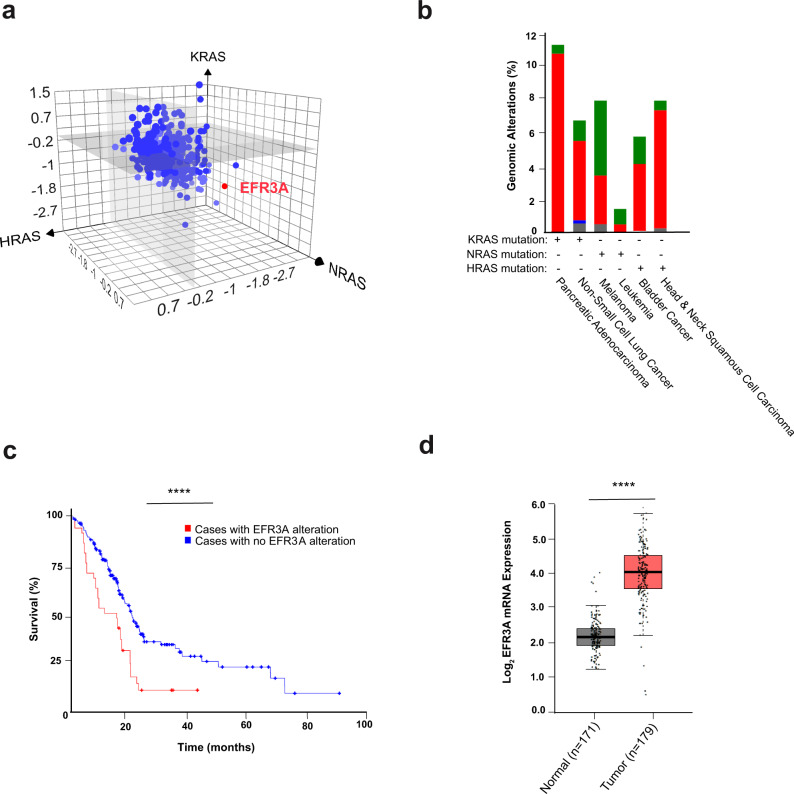
Fig. 1. Identification of EFR3A as a potential vulnerability in KRAS-mutant pancreatic cancer.
a Mean log2 fold-enrichment of the 5 sgRNAs targeting each of the 474 genes encoding proteins of the RAS interactomes (determined by BirA-mediated proximity labeling) in the isogenic background of HEK-HT cells transformed by oncogenic (G12V) HRAS (x-axis), KRAS (y-axis), or NRAS (z-axis). b The frequency (%) that the EFR3A gene exhibits amplification and copy number variation (red bar), a point mutation (green bar), deletion (blue bar), or multiple alterations (gray bar) in 6 different RAS-mutant cancers from the cBiportal PanCan TCGA dataset. Only cancers with ≥2% genomic alterations are shown. c A Kaplan–Meier plot of overall survival of pancreatic adenocarcinoma cases with (n = 42) versus without (n = 327) a genomic alteration in EFR3A (p = 2.034e–4), as determined from 5 pancreatic cancer datasets (ICGC, Nature 2012; TCGA PanCancer Atlas; UTSW Pancreatic Cancer; TCGA Firehose Legacy; QCMG, and Nature 2016), p = 0.01504. d A boxplot of the log2 mRNA expression of EFR3A, normal max (3.1), min (1.3), center (2.2); tumor max (4.5), min (0.3), center (4.2) in 179 pancreatic adenocarcinoma versus 171 normal tissues based on GEPIA analysis of the PAAD dataset. Significance values calculated by one-sided logrank test for (c) and one-way ANOVA analysis for (d): ****p < 0.0001. Percentiles in the box plots pre-set at 50% (higher) and 50% (lower).

