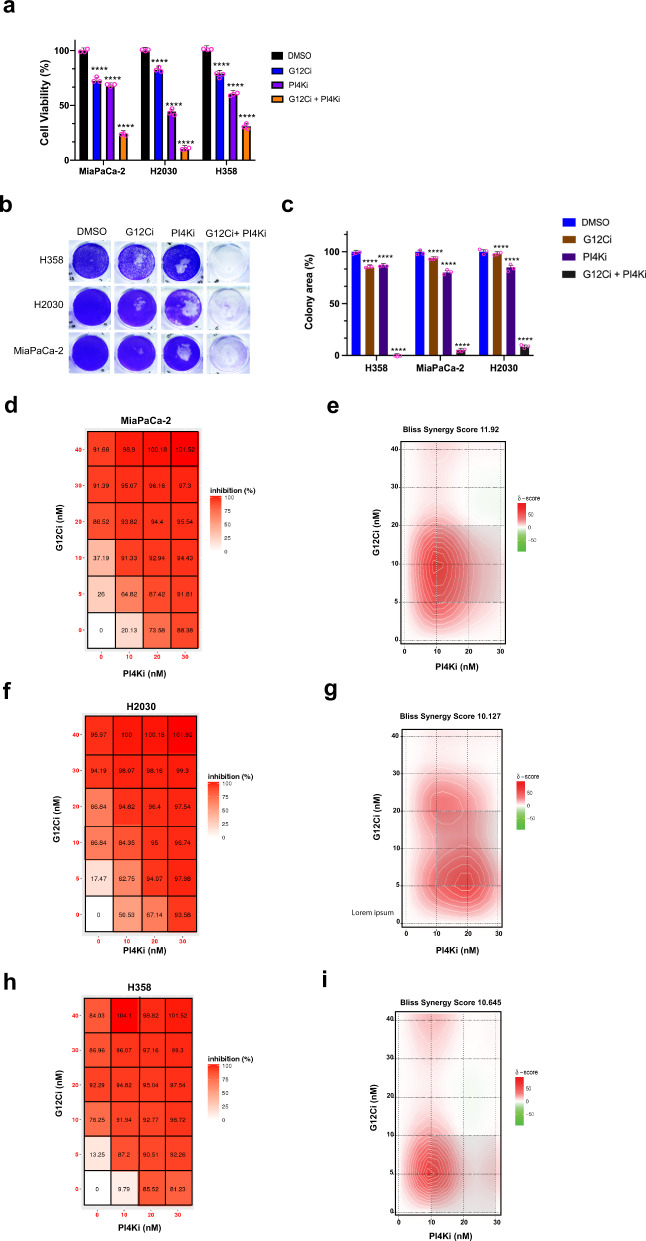
Fig. 10. A PI4KA inhibitor synergized with a clinical RASG12C inhibitor.
a Mean ± SD cell viability, as assessed by the Cell Titer Glo assay, of the KRASG12C-mutant human cancer cell lines MiaPaCa-2, H2030, and H358 treated with a fixed concentration of vehicle (DMSO), 5 nM of the RASG12C inhibitor (G12Ci) AMG510, 10 nM of the PI4KA inhibitor (PI4Ki) C7, or both drugs at these concentrations. b, c An example of (b) colony formation, as detected by crystal violet staining, which is (c) plotted as the mean ± SD of colony area, of MiaPaCa-2, H2030, and H358 cells treated with the indicated drugs at a IC10 dose for 12 days. d, f, h Dose response inhibition matrix and (e, g, i) BLISS synergy plot of (b, c) MiaPaCa-2, d, e H2030, and (f, g) H358 cells treated with the indicated drug concentrations for 72 h. a–i Representative of 3 biological replicates assayed in triplicate. Replicate experiments are provided in Supplementary Fig. 15. Significance values were calculated by two-sided Welch’s t-test (a, c): ****p < 0.0001. Specific p values for (a) are 0.000021 (G12Ci), 0.000036 (PI4Ki), and 0.000047 (G12Ci + -PI4Ki) for MiaPaCa-2 cells, 0.000043 (G12Ci), 0.000034 (PI4Ki), and 0.000038 (G12Ci + PI4Ki) for H2030 cells, and 0.000013 (G12Ci), 0.000021 (PI4Ki), and 0.000019 (G12Ci + PI4Ki) for H358 cells, for c are 0.000021 (G12Ci), 0.000036 (PI4Ki), and 0.000032 (G12Ci + -PI4Ki) for MiaPaCa-2 cells, 0.000025 (G12Ci), 0.000016 (PI4Ki), and 0.000033 (G12Ci + PI4Ki) for H2030 cells, and 0.000038 (G12Ci), 0.000024 (PI4Ki), and 0.000017 (G12Ci + PI4Ki) for H358 cells.

