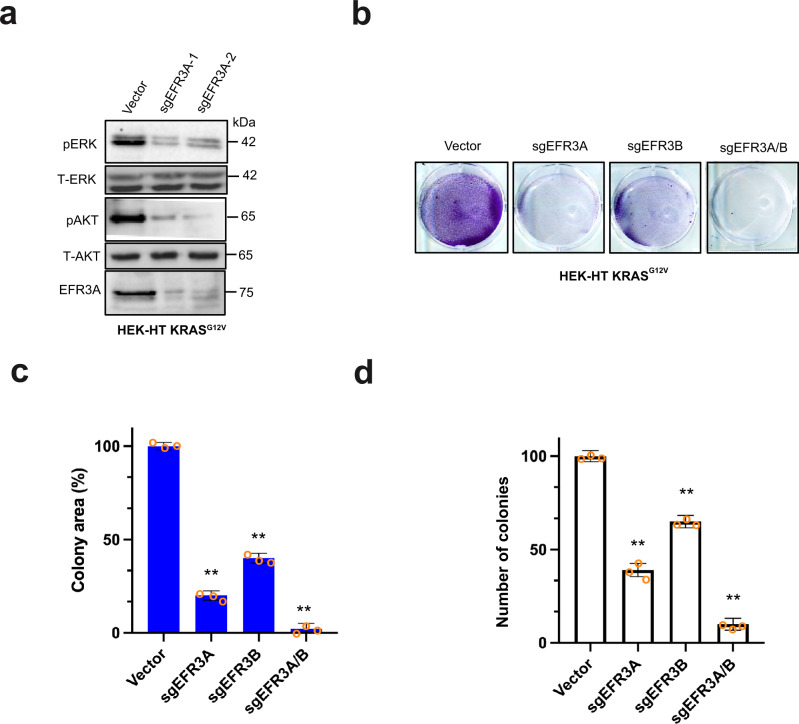
Fig. 2. EFR3A loss inhibits oncogenic RAS signaling and transformed growth in isogenic cells.
a–d Analysis of the (a) levels of phosphorylated (P) and/or total (T) ERK, AKT, EFR3A, and actin (as a loading control), as assessed by immunoblot, b an example of colony formation, as assessed by crystal violet staining, which is (c) plotted as the mean ± SD total colony area, and (d) the mean ± SD number of colonies growing in soft agar of human HEK-HT cells transformed by oncogenic KRASG12V (codon-optimized in d) engineered to stably express Cas9 and a vector encoding no sgRNA (vector) or the indicated sgRNAs. Representative of 3 biological replicates tested in 3 independent experiments. Replicate experiments and full-length gels are provided in Supplementary Fig. 11. Significance values calculated by one-way ANOVA test for (c, d): **p < 0.01. Specific p values for (c) are 0.0078 (sgEFR3A), 0.0045 (sgEFR3B), and 0.0016 (sgEFR3A/B), and (d) are 0.0059 (sgEFR3A), 0.0083 (sgEFR3B), and 0.0026 (sgEFR3A/B).

