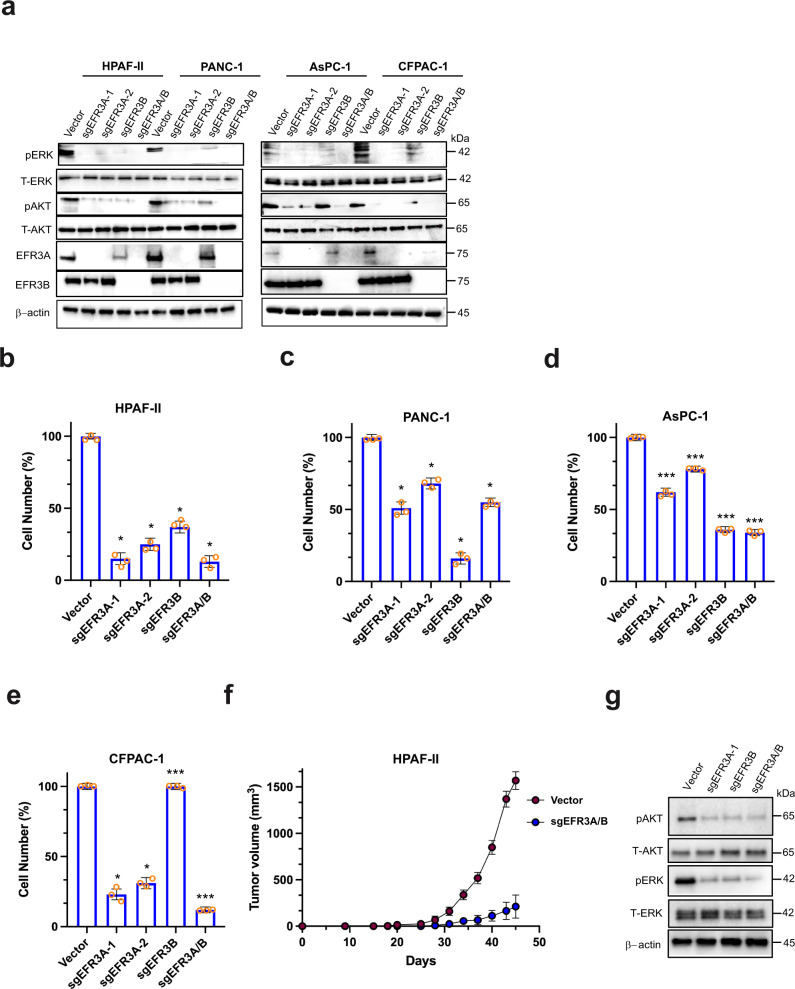
Fig. 3. EFR3A loss inhibits pancreatic adenocarcinoma transformed and tumorigenic growth.
a–e Analysis of the (a) levels of phosphorylated (P) and/or total (T)- ERK, AKT, EFR3A, EFR3B, and actin (as a loading control), as assessed by immunoblot, and (b–e) the mean ± SD cell number (compared to vector control) over time, as assessed by the Titer Glo assay, of the indicated human KRAS mutation-positive pancreatic adenocarcinoma cell lines engineered to stably express Cas9 and a vector encoding no sgRNA (vector) or the indicated sgRNAs. f Mean ± SD tumor volume (mm3) versus time of HPAF-II cells engineered to stably express Cas9 and a vector encoding no sgRNA (vector) or the indicated sgRNAs after injected into mice. g Levels of (P) and/or (T) ERK, AKT, and actin (as a control), as assessed by immunoblot, in the indicated tumors from panel f. a: Representative of 3 biological replicates. b–e Representative of 3 biologic replicates assayed in triplicate. f The two cell lines were each injected into 5 mice. g Representative of 2 biological replicates. Replicate experiments and full-length gels are provided in Supplementary Fig. 11. Significance values calculated by one-way ANOVA test for (b–f): *p < 0.05 and ***p < 0.001. Specific p values for (b) are 0.0324 (sgEFR3A-1), 0.0227 (sgEFR3A-2), 0.0428 (sgEFR3B), and 0.0487 (sgEFR3A/B), (c) are 0.0241 (sgEFR3A-1), 0.0472 (sgEFR3A-2), 0.0281 (sgEFR3B), and 0.0307 (sgEFR3A/B), d are 0.00024 (sgEFR3A-1), 0.00062 (sgEFR3A-2), 0.00045 (sgEFR3B), and 0.00031 (sgEFR3A/B), e are 0.046 (sgEFR3A-1), 0.0381 (sgEFR3A-2), 0.00053 (sgEFR3B), and 0.00034 (sgEFR3A/B), and (f) is **p < 0.01.

